
Motorized Transportation Safety
In 2021, the National Highway Traffic Safety Administration estimated that 42,915 people died in motor vehicle traffic crashes. This is an increase of approximately 10% from the 38,824 fatalities in 2020.1 In Minnesota, 488 people died on the state’s roadways in 2021, a 24% increase in traffic fatalities from 2020. The nation’s transportation network has prioritized mobility over safety since cars first started sharing roadways with pedestrians, bicyclists, streetcars and horses over a century ago. For much of the twentieth century, deaths or serious injuries related to traffic crashes were seen as an unfortunate, but unavoidable, side effect of the automobile. However, this sentiment has started to change. The federal government began enacting requirements for vehicle safety starting in the 1970s. Initiatives like Vision Zero and Minnesota’s Toward Zero Deaths program have grown over the previous two decades. These initiatives contend that even a single death on the nation’s roadways is too many.
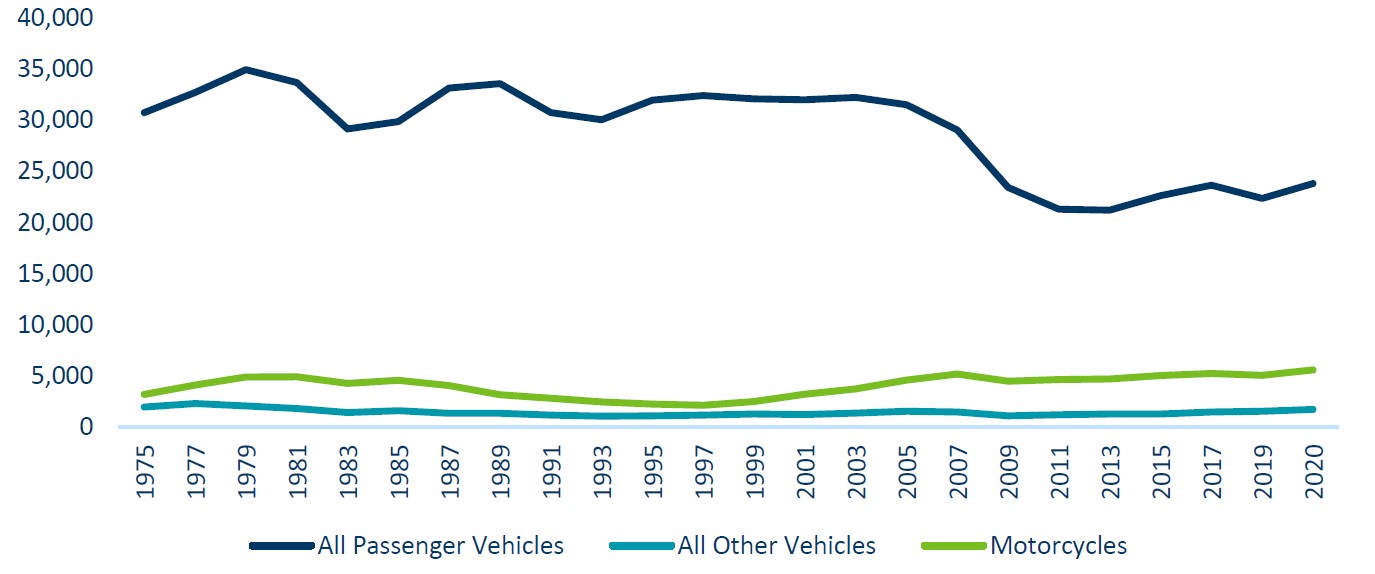
U.S. roadways have become safer even as they handle more traffic every year. More people are traveling, but deaths and injuries have fallen from their peak decades ago. For roadway users, deaths peaked in the 1970s (Figure 1). Note that the 2020 data is based on the most recent year available from Fatality Analysis Reporting System (FARS) Annual Report File (ARF). The data is subject to change when it is finalized the following year. The decline in deaths and serious injuries is the result of many efforts. Vehicle design changes have made for a safer driver experience. Improvements to roadway design and added laws and policies have improved traffic safety since the mid-twentieth century. Even with these improvements, however, driving a motor vehicle is still one of the main causes of unintentional death in the country. In the first half of life, more Americans die from unintentional injuries, which include motor vehicle crashes, than any other cause, include suicide, homicide, cancer, HIV or the flu. 2 Transportation safety must be improved until there are no deaths from motor vehicle crashes.
Figure 1: National total deaths in motor vehicle crashes separated by vehicle type (1975 to 2020).3,4
Related Trends

Citations
- U.S. Department of Transportation, “Newly Released Estimates Show Traffic Fatalities Reached a 16-Year High in 2021,” May 17, 2022, https://www.nhtsa.gov/press-releases/early-estimate-2021-traffic-fatalities.
- Centers for Disease Control and Prevention, “Injuries and violence are leading causes of death,” Injury Center, page last reviewed February 28, 2022, https://www.cdc.gov/injury/wisqars/animated-leading-causes.html.“
- “Traffic Safety Facts Annual Report Tables,” National Highway Traffic Safety Administration, May 25, 2021, https://cdan.nhtsa.gov/tsftables/tsfar.htm#.
- National Highway Traffic Safety Administration, “Occupants killed in fatal crashes,” Fatality Analysis Reporting System: 2006-2019 Final File and 2020 Annual Report File, https://cdan.dot.gov/SASStoredProcess/guest 5 U.S. Department of Transportation “Overview of Motor Vehicle Crashes in 2020,” National Highway Traffic Safety Administration, March 2022, https://crashstats.nhtsa.dot.gov/Api/Public/ViewPublication/813266.