
Freight Forecasts
Utilizing the data to determine the direction of freight movements by mode, whether they be within, through, into or out of Minnesota is critical to understanding the supply chain of key industries in the state. How these flows will likely change by commodity and year, is equally critical for the freight plan to be better able to understand the actions needed in order to maintain and support infrastructure to enhance efficient supply chains for Minnesota’s industries and businesses.
By analyzing future freight flow patterns actions can further be tailored to not just the current needs of Minnesota’s business driven economy now, but well into the future.
Freight Analysis Framework
The Freight forecast for this freight plan is based on Federal Highway Administration’s (FHWA) Freight Analysis Framework (FAF). The Bureau of Transportation Statistics (BTS) with the support of the FHWA produce the FAF every five years, which provides estimates of tonnage, value and ton-miles moved by origin-destination pair, commodity type and transportation mode. The most recent version, FAF5, provides data for the base year (2017), recent years (2018-22) and forecasts up to 2050. FAF 5 data is used to estimate the freight tonnage and value by mode in Minnesota by 2050 and is the primary data utilized for the freight forecasts in this plan.
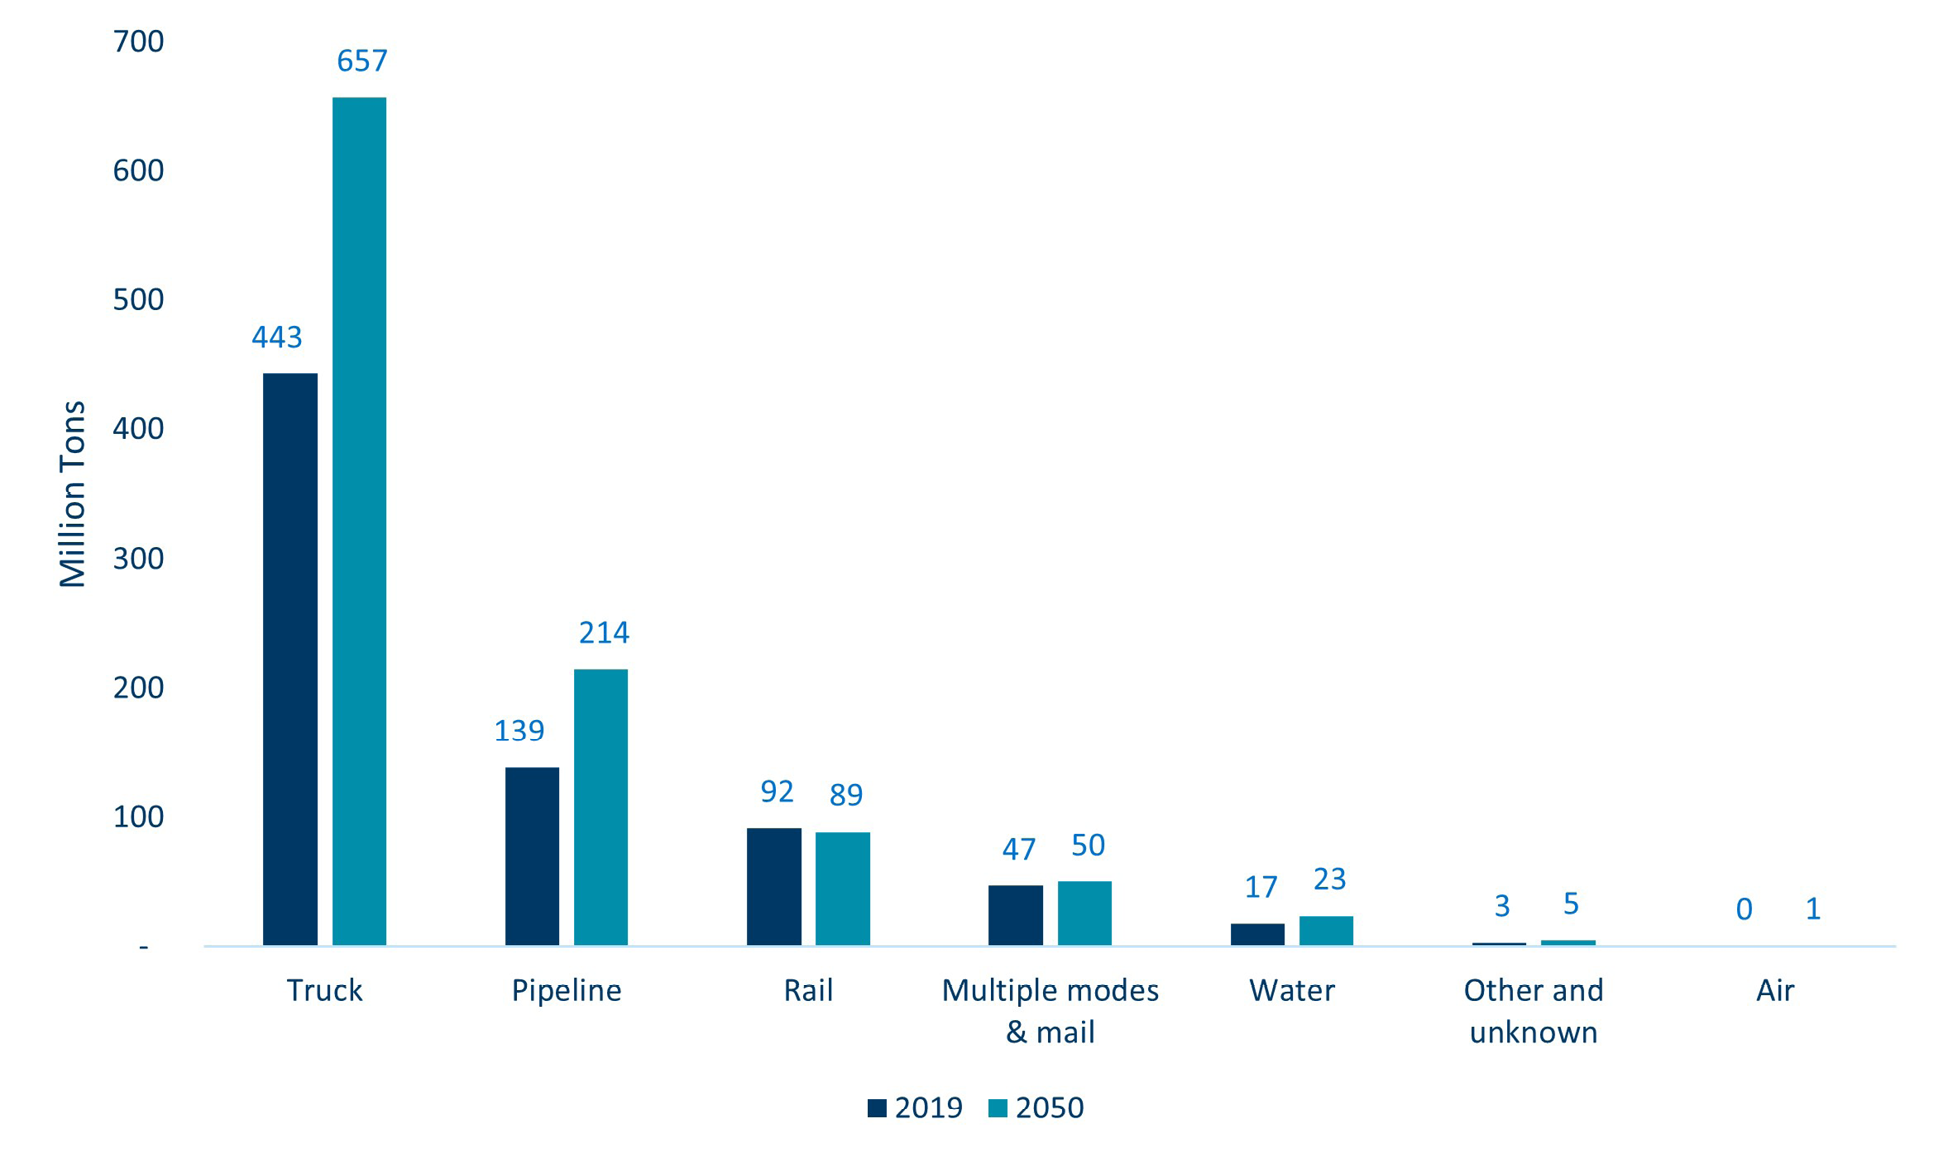
Figure 4-1 and Figure 4-2 illustrate the modal split in 2019 and 2050 forecast by tonnage and value of freight respectively. Total freight flows to, from and within Minnesota are projected to increase from 740 million tons in 2019 to 1.04 billion tons in 2050, growing at a 1.1% rate per year.
The modal shares are not expected to change dramatically with Truck having the highest share of 63%, followed by Pipeline with 21% share and Rail with 9%. Air cargo flows are estimated to increase the most by 2050 at a 3% rate annually while Rail is expected to remain at the same levels with minor losses of -0.1% per year.
Figure 4-1: Minnesota Freight Tonnage, Base Year and 2050 Forecast
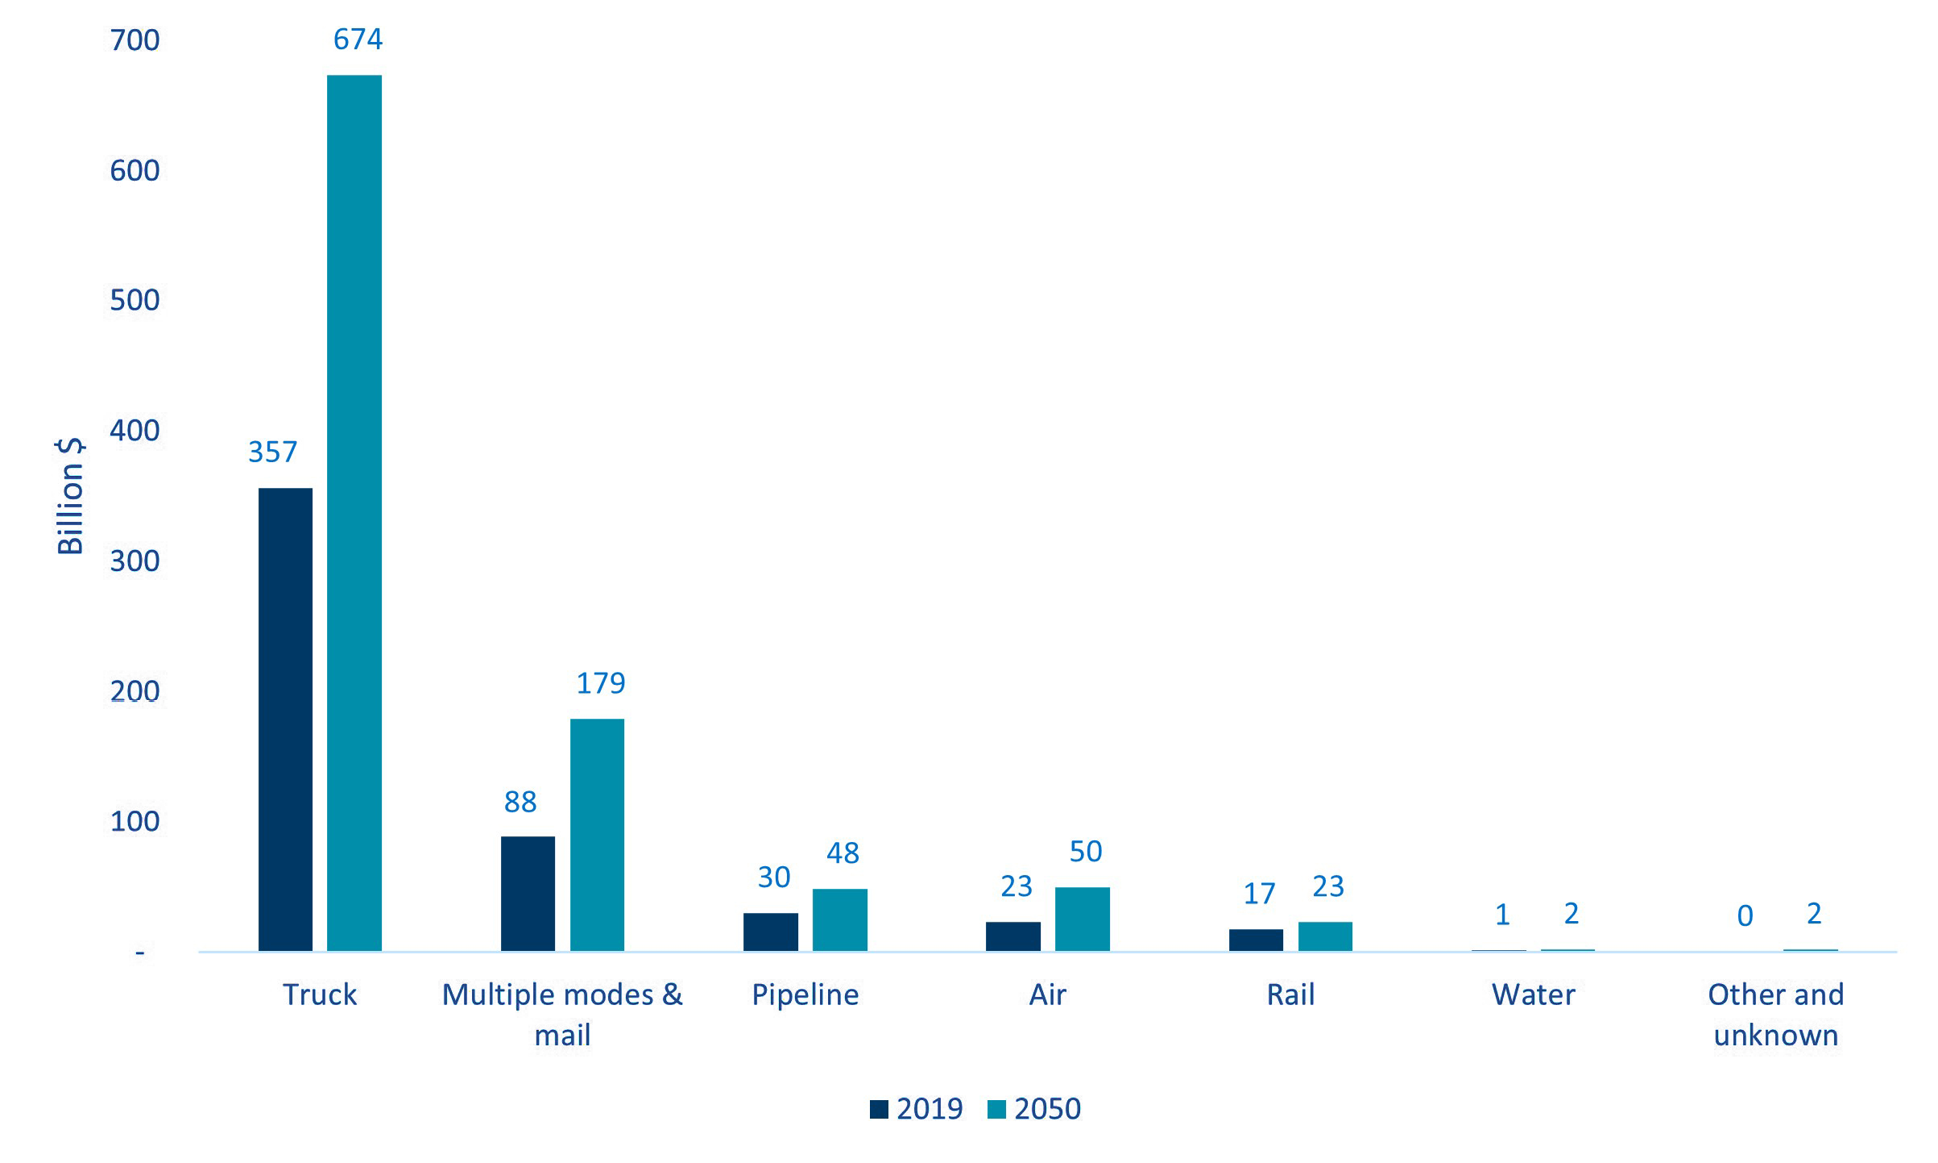
The value of freight moving to, from and within the State is projected to increase 2.1% annually by 2050 from $517 billion to $978 billion. Truck cargo and multiple modes and mail value will account for 87% of the total freight value in Minnesota by 2050, growing at 2.1 and 2.3% per year.
Figure 4-2: Minnesota Freight Value, Base Year and 2050 Forecast
Of the 1.04 billion tons of freight in 2050, 92% or 945 million tons will be domestic flows to and from other states and within Minnesota, while 5% will be imports and 2% exports. Similarly, 90% of freight value is attributed to domestic cargo, 6% in imports and 4% in exports — as shown in Table 4-1.
Table 4-1: Minnesota Forecast Freight Tonnage and Value by Trade Type
| Trade Type | Million Tons (2050) | Billion USD (2050) |
|---|---|---|
| Domestic | 945 | 868 |
| Export | 26 | 42 |
| Import | 68 | 68 |
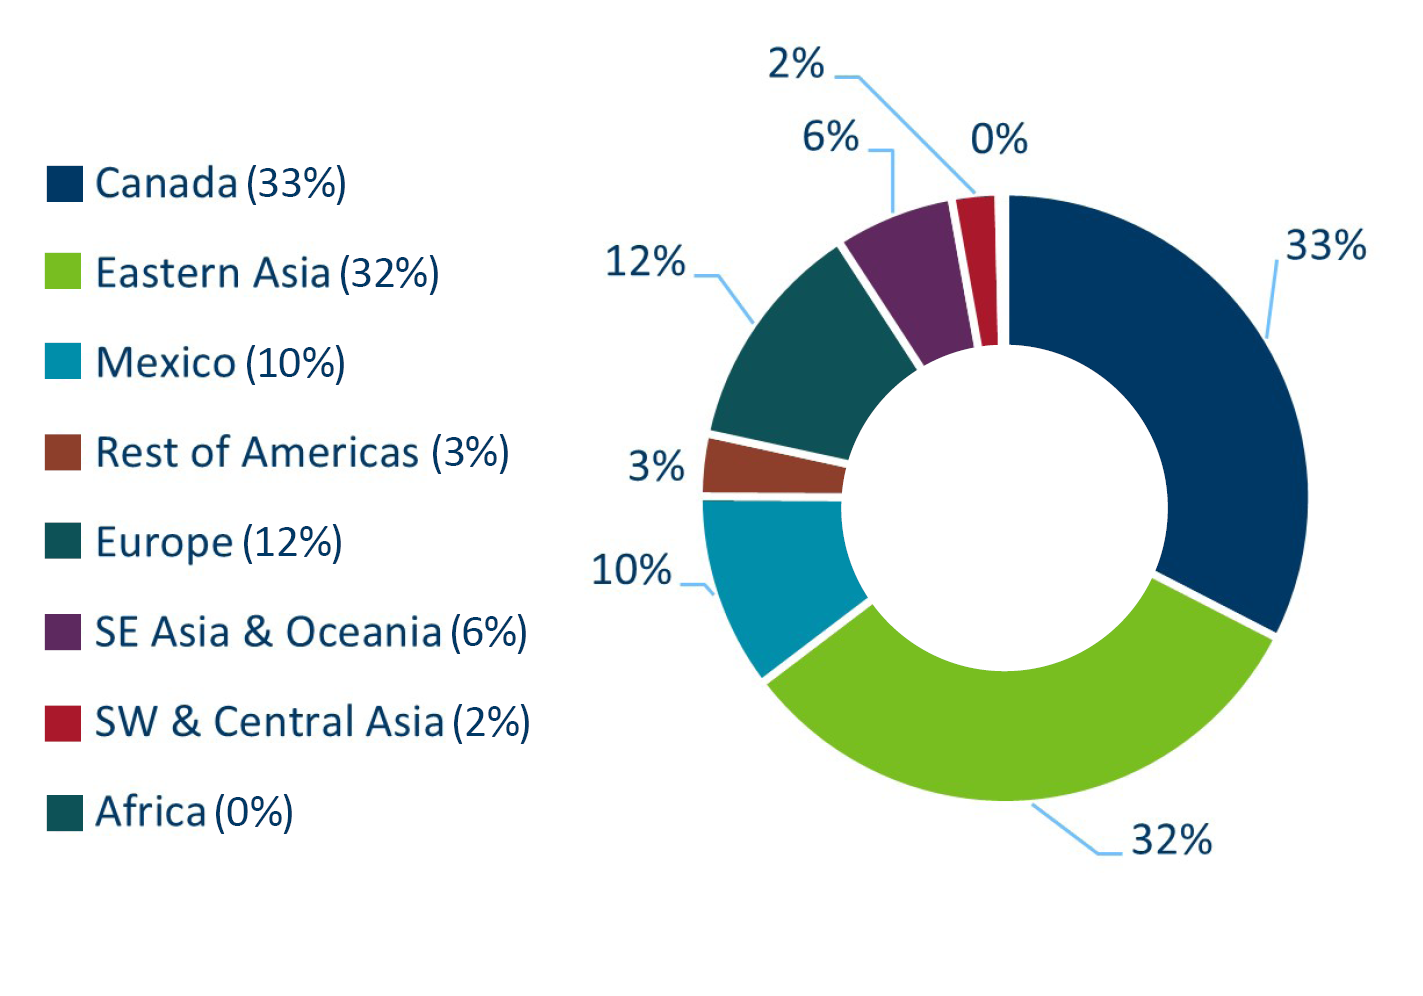
The proximity to Canada and the various ports of entry in the Canadian-Minnesotan border make Canada the number one foreign trading partner with 74% of import and export tonnage and 33% of value in 2050. Eastern Asia follows as the second most significant trading partner with 13% of import and export tonnage and 32% of the value; Mexico is the third with 7% of import and export tonnage and 10% of value as illustrated in Figure 4-3.
Figure 4-3: Estimated Tonnage Share of International Trade Partners by 2050
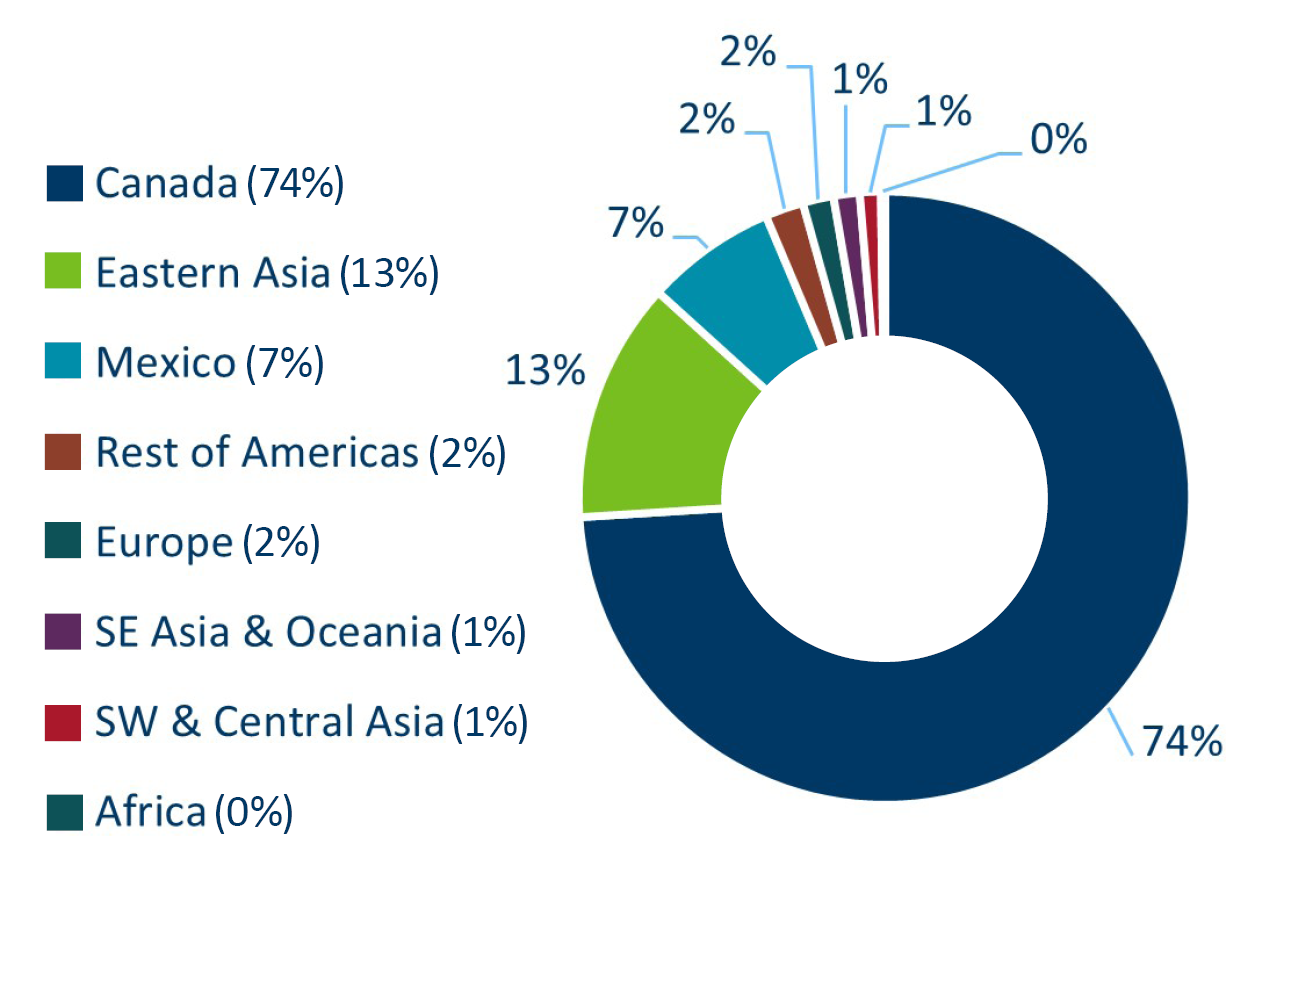
Figure 4-4: Estimated Value Share of International Trade Partners by 2050
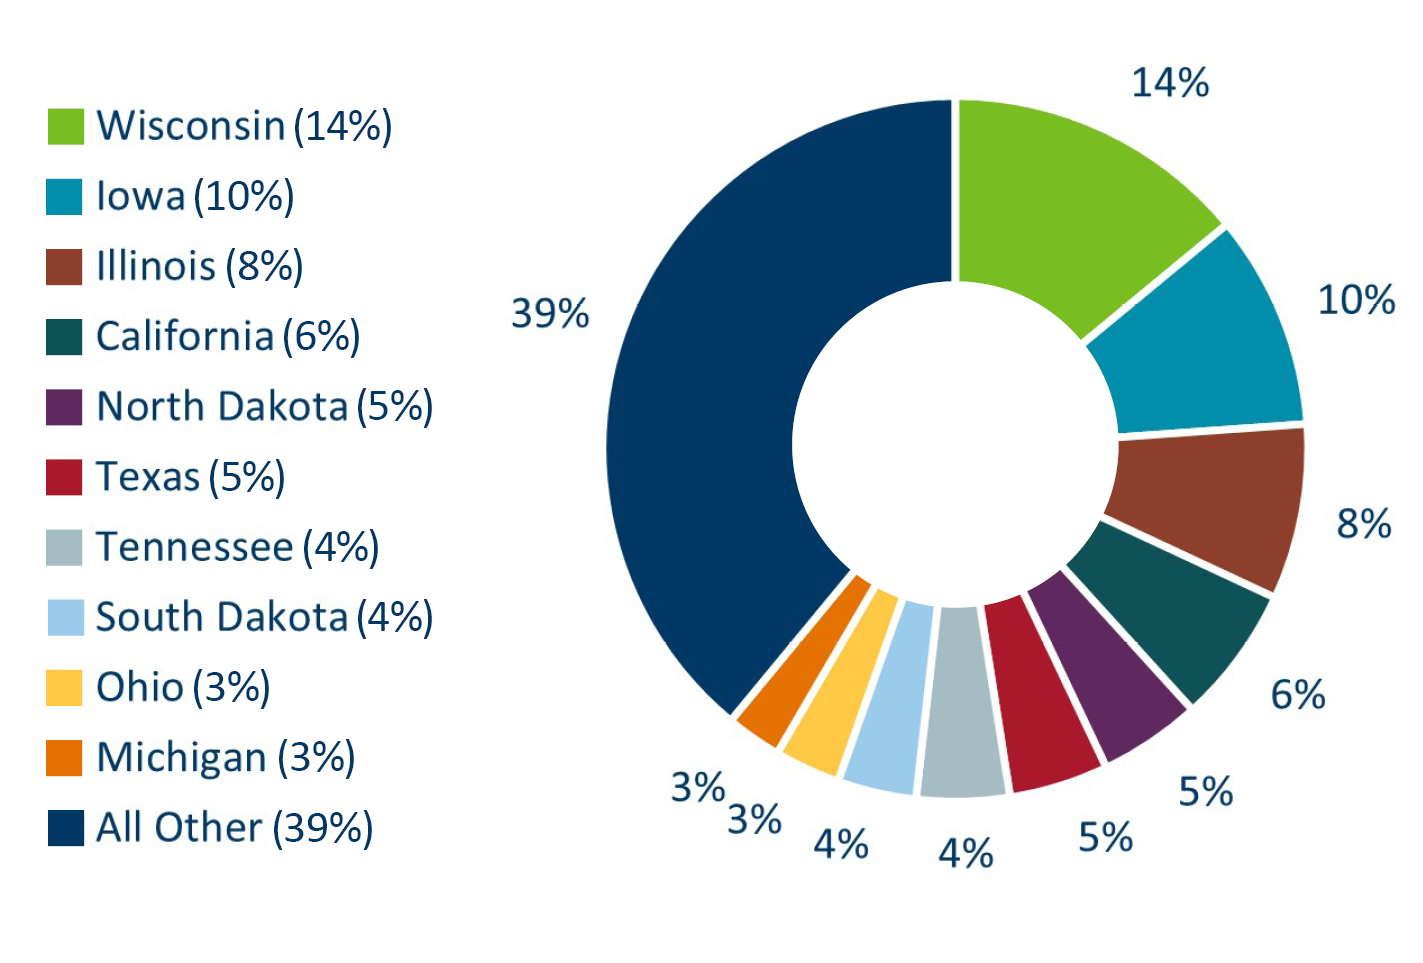
Domestic trade in 2050 is also affected by proximity to neighboring states such as Iowa, Wisconsin, North and South Dakota. This will continue to account for most of freight flows in 2050 by tonnage (62%). However, in terms of value these states account only for 32% of 2050 freight value—as shown in Figure 4-5.
Figure 4-5: Estimated Tonnage Share of Domestic Trade Partners by 2050
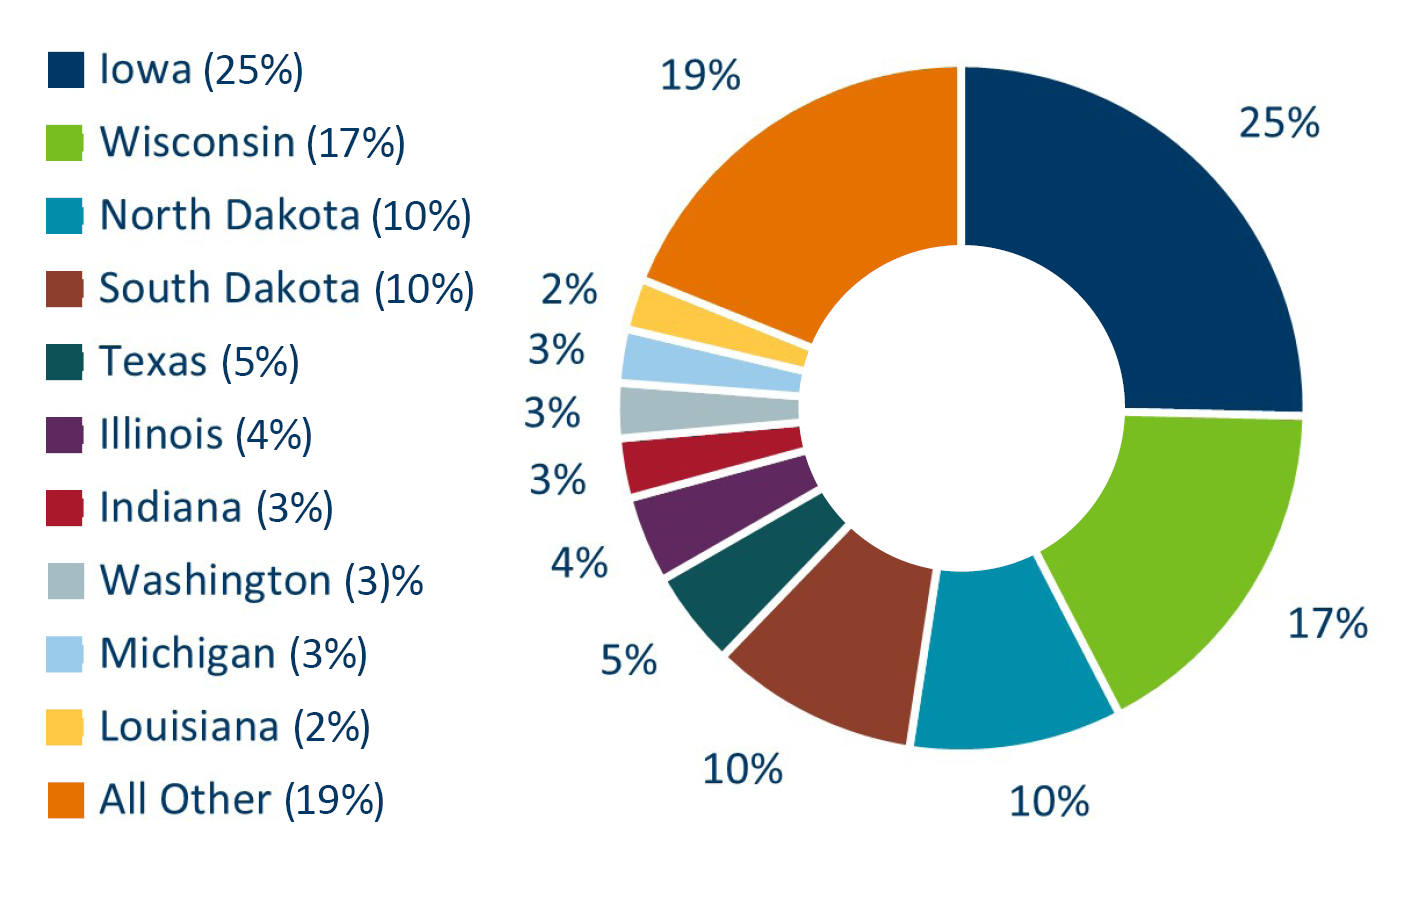
Figure 4-6: Estimated Value Share of Domestic Trade Partners by 2050
Truck
Truck tons will total 657 million in 2050, of which 639 million will be domestic, 11.7 million exports and 6.7 million imports. The same commodities will be at the top four in 2050 as in 2019 (cereal grains, gravel, agricultural products and nonmetal mineral products) growing at 1% annually. About 70% to 75% of these commodity truck flows will be flows within Minnesota, which are in line with the 63% truck flows within Minnesota overall. Live animals, mainly from Minnesota to neighboring states, are projected to have the highest truck growth by 2050, growing by 210%. Gasoline is expected to be the only commodity in the top ten that will decrease in 2050, decreasing by 28%, as shown in Table 4-2.
Table 4-2: Major Highway Commodities Tonnage, 2050
| Commodity | Thousand Tons (2050) | Highway Tonnage Share (Percent) | Rank Change (2019-2050) | Total Change 2019-2050 | Annual Change 2019-2050 |
|---|---|---|---|---|---|
| Cereal grains | 104,773 | 16% | - | 21% | 1% |
| Gravel | 100,144 | 15% | - | 53% | 1% |
| Other ag prods. | 55,052 | 8% | - | 40% | 1% |
| Nonmetal min. prods. | 49,336 | 8% | - | 51% | 1% |
| Animal feed | 43,509 | 7% | +1 | 92% | 2% |
| Other foodstuffs | 31,739 | 5% | +1 | 55% | 1% |
| Mixed freight | 23,122 | 4% | +2 | 93% | 2% |
| Live animals/fish | 21,363 | 3% | +8 | 210% | 4% |
| Gasoline | 20,356 | 3% | -4 | -28% | -1% |
| Nonmetallic minerals | 17,811 | 3% | +1 | 65% | 2% |
Mixed freight shipments are expected to be the number one truck commodity by value in 2050 as shown in Table 4-2 growing by 93% from 2019. Pharmaceuticals’ value is projected to grow 207%, the highest increase of the top ten commodities by value, making it the commodity with the second highest value. Live fish, chemical products and plastics will also have a significant increase in terms of value of freight shipped by truck in Minnesota, as shown in Table 4-3.
Table 4-3: Major Highway Commodities Value, 2050
| Commodity | Million USD (2050) | Highway Value Share (Percent) | Rank Change (2019-2050) | Total Change 2019-2050 | Annual Change 2019-2050 |
|---|---|---|---|---|---|
| Mixed freight | 72,662 | 11% | - | 93% | 2% |
| Pharmaceuticals | 53,564 | 8% | +5 | 207% | 4% |
| Machinery | 47,272 | 7% | -1 | 77% | 2% |
| Plastics/rubber | 44,309 | 7% | +2 | 141% | 3% |
| Electronics | 42,459 | 6% | -2 | 86% | 2% |
| Motorized vehicles | 38,716 | 6% | -2 | 75% | 2% |
| Misc. mfg. prods. | 35,584 | 5% | +1 | 148% | 3% |
| Other foodstuffs | 29,170 | 4% | -3 | 55% | 1% |
| Live animals/fish | 26,896 | 4% | +9 | 205% | 4% |
| Chemical prods. | 25,802 | 4% | +6 | 170% | 3% |
Rail
Rail flows in FAF 5 include only carload shipments as intermodal traffic is reported under the multiple modes and mail category. As presented in Table 4-4 the two commodities with the highest tonnage in 2050 will be cereal grains and metallic ores, similarly to 2019, with cereal grains increasing 33% and metallic ores decreasing by 34%. Almost 30% of the cereal grains and 90% of the metallic ores shipped by rail will be internal Minnesota flows, while 9.8 million tons of cereal grains will be shipped to Washington State (35% of total cereal rail flows) for export to Asian countries. Animal feed and fertilizers are projected to have the highest tonnage increase, increasing by 138% and 187%. The highest decrease in railroad carload flows will be for coal following the general coal decline as energy shifts to cleaner alternatives.
Table 4-4: Major Rail Commodities Tonnage, 2050
| Commodity | Thousand Tons (2050) | Rail Tonnage Share (Percent) | Rank Change (2019-2050) | Total Change 2019-2050 | Annual Change 2019-2050 |
|---|---|---|---|---|---|
| Cereal grains | 28,287 | 32% | - | 33% | 1% |
| Metallic ores | 11,782 | 13% | - | -34% | -1% |
| Natural sands | 6,088 | 7% | +2 | -6% | 0% |
| Animal feed | 5,793 | 7% | +5 | 138% | 3% |
| Fertilizers | 5,540 | 6% | +7 | 187% | 3% |
| Other ag prods. | 4,884 | 6% | +1 | 44% | 1% |
| Nonmetallic minerals | 4,838 | 5% | +1 | 74% | 2% |
| Other foodstuffs | 3,486 | 4% | +2 | 54% | 1% |
| Fuel oils | 3,001 | 3% | -3 | -38% | -2% |
| Coal | 2,798 | 3% | -7 | -77% | -5% |
The composition of rail flows in terms of value in 2050 will be somewhat different from that of tonnage, shown in Table 4-5. Miscellaneous manufactured products from Eastern Asia which are mainly imported through ports in California, Georgia and Washington are projected to increase 203% from 2019 for a total of $2.2 billion, accounting for 10% of rail value. Other commodities with significant gains from 2019 are fertilizers imported from Canada, plastics, animal feed exported to Canada and Mexico, gasoline and furniture.
Table 4-5: Major Rail Commodities Value, 2050
| Commodity | Million USD (2050) | Retail Value Share (Percent) | Rank Change (2019-2050) | Total Change 2019-2050 | Annual Change 2019-2050 |
|---|---|---|---|---|---|
| Cereal grains | 4,400 | 19% | - | 33% | 1% |
| Misc. mfg. prods. | 2,234 | 10% | +5 | 203% | 4% |
| Other foodstuffs | 2,145 | 9% | - | 53% | 1% |
| Other ag prods. | 1,613 | 7% | - | 43% | 1% |
| Fertilizers | 1,222 | 5% | +4 | 82% | 2% |
| Plastics/rubber | 1,131 | 5% | +4 | 96% | 2% |
| Animal feed | 902 | 4% | +6 | 102% | 2% |
| Gasoline | 893 | 4% | +3 | 59% | 2% |
| Furniture | 817 | 4% | +8 | 210% | 4% |
| Metallic ores | 750 | 3% | -5 | -30% | -1% |
Water
Water cargo in Minnesota is estimated to grow from 17 million tons in 2019 to 23 million in 2050, a 36% increase. Over 99% of water flows is from the ten commodities shown in Table 4-6. Lower value, bulk materials, such as agricultural products and construction material are usually shipped via water as a more economical alternative. Cereal grains are projected to increase 77% by 2050, being the commodity with the highest share accounting for 4.9 million tons, followed by gravel with 4.4 million tons, a 46% increase from 2019. Metallic ores shipped by water are projected to decrease 33% by 2050, accounting for 14% of the total water share.
Table 4-6: Major Water Commodities Tonnage, 2050
| Commodity | Thousand Tons (2050) | Water Tonnage Share (Percent) | Rank Change (2019-2050) | Total Change 2019-2050 | Annual Change 2019-2050 |
|---|---|---|---|---|---|
| Cereal grains | 4,859 | 21% | +2 | 77% | 2% |
| Gravel | 4,426 | 19% | - | 46% | 1% |
| Nonmetallic minerals | 4,128 | 18% | +2 | 60% | 2% |
| Natural sands | 3,618 | 15% | - | 37% | 1% |
| Metallic ores | 3,343 | 14% | -4 | -33% | -1% |
| Other ag prods. | 1,217 | 5% | - | 113% | 2% |
| Animal feed | 1,079 | 5% | - | 124% | 3% |
| Natural gas and other fossil products | 273 | 1% | +5 | 6272% | 14% |
| Fertilizers | 213 | 1% | -1 | 152% | 3% |
| Other foodstuffs | 167 | 1% | +18 | 97110% | 25% |
Cereal grains, worth of $583 million, will also be the number one commodity in terms of value for water flows in Minnesota. The value of other agricultural products and animal feed is projected to grow 3 and 2% annually for a total worth of $576 million. Other significant commodities by value include metallic ores, gravel, natural sands, fertilizers, machinery as shown in Table 4-7. The tenth commodity by value in 2050 will be other prepared foodstuffs which will increase from $1.2 million in 2019 to $61 million in 2050. Almost 90% of the value will be food from Minnesota to Louisiana for exports to the Rest of Americas.
Table 4-7: Major Water Commodities Value, 2050
| Commodity | Million USD (2050) | Water Value Share (Percent) | Rank Change (2019-2050) | Total Change 2019-2050 | Annual Change 2019-2050 |
|---|---|---|---|---|---|
| Cereal grains | 583 | 27% | - | 87% | 2% |
| Other ag prods. | 361 | 17% | +1 | 120% | 3% |
| Animal feed | 216 | 10% | +1 | 93% | 2% |
| Metallic ores | 207 | 10% | -2 | -33% | -1% |
| Gravel | 79 | 4% | - | 45% | 1% |
| Natural sands | 72 | 3% | - | 37% | 1% |
| Fertilizers | 71 | 3% | +2 | 153% | 3% |
| Machinery | 70 | 3% | - | 135% | 3% |
| Nonmetallic minerals | 70 | 3% | -2 | 68% | 2% |
| Other foodstuffs | 61 | 3% | +15 | 5067% | 14% |
Air
Time sensitive, high value cargo is typically transported by air which has the highest transportation costs. Air is the mode with the lowest tonnage flows in Minnesota in 2019 and 2050. Commodities transported by air are typically light but high in value. In 2050 air cargo moved in Minnesota is projected to have a value of $82 thousand per ton, 13% lower than the $95 thousand per ton in 2019.
Air freight tonnage is projected to grow from 240 thousand tons in 2019 to 599 thousand in 2050, representing an average annual growth rate of 3%. The commodity with the highest tonnage share, 35% and 210 thousand tons in 2050, will be precision instruments (similar to 2019) as shown in Table 4-8. Other commodities shipped by air include plastics, electronics, textiles and machinery which will account for 34% of total air cargo and 50 thousand tons. It is worth mentioning newsprint and milled grain products will be among the top ten highest commodities by tonnage moved via air by 2050.
Table 4-8: Major Air Commodities Tonnage, 2050
| Commodity | Thousand Tons (2050) | Air Tonnage Share (Percent) | Rank Change (2019-2050) | Total Change 2019-2050 | Annual Change 2019-2050 |
|---|---|---|---|---|---|
| Precision instruments | 210 | 35% | - | 158% | 3% |
| Plastics/rubber | 71 | 12% | +2 | 336% | 5% |
| Electronics | 52 | 9% | -1 | 106% | 2% |
| Textiles/leather | 47 | 8% | +5 | 775% | 7% |
| Machinery | 31 | 5% | - | 98% | 2% |
| Chemical prods. | 23 | 4% | +1 | 153% | 3% |
| Newsprint/paper | 22 | 4% | +11 | 1160% | 9% |
| Nonmetal min. prods. | 21 | 3% | - | 215% | 4% |
| Milled grain prods. | 18 | 3% | +19 | 2014% | 10% |
| Other ag prods. | 12 | 2% | - | 136% | 3% |
The composition of air freight by value in Minnesota in 2050 is shown in Table 4-9. A major change in the top ten commodities by value is not expected. Precision instruments are projected to grow 3% annually and account for 60% of the total air freight value. Electronics and pharmaceuticals are projected to grow 2 and 3% annually, while the commodities with the highest annual growth are expected to be plastics and textiles at 4% each.
Table 4-9: Major Air Commodities Value, 2050
| Commodity | Million USD (2050) | Air Value Share (Percent) | Rank Change (2019-2050) | Total Change 2019-2050 | Annual Change 2019-2050 |
|---|---|---|---|---|---|
| Precision instruments | 29,808 | 60% | - | 130% | 3% |
| Electronics | 8,708 | 18% | - | 81% | 2% |
| Pharmaceuticals | 2,773 | 6% | +1 | 132% | 3% |
| Machinery | 2,068 | 4% | -1 | 72% | 2% |
| Plastics/rubber | 1,682 | 3% | - | 200% | 4% |
| Misc. mfg. prods. | 804 | 2% | - | 114% | 2% |
| Chemical prods. | 749 | 2% | - | 118% | 3% |
| Textiles/leather | 679 | 1% | +2 | 256% | 4% |
| Transport equip. | 452 | 1% | -1 | 32% | 1% |
| Motorized vehicles | 303 | 1% | +2 | 137% | 3% |
Pipeline
There is a limited number of commodities that are shipped in pipelines while access to privately owned pipeline system data is very limited. Based on FAF 5 estimates there are eight commodities moved through pipeline in Minnesota. By 2050, the total tonnage of pipeline cargo will increase by 55% and the value will increase by 62%. As seen in Table 4-10, the number one commodity will be natural gas and other fossil products which will account for 72% of pipeline tonnage and 59% of value. Crude petroleum, which is estimated to increase by 64% by tonnage, will be the second highest commodity with 28% share. It is also projected to increase by 90% in total (2% annually) and have 39% of total value pipeline share as shown in Table 4-11.
Table 4-10: Major Pipeline Commodities Tonnage, 2050
| Commodity | Thousand Tons (2050) | Pipeline Tonnage Share (Percent) | Rank Change (2019-2050) | Total Change 2019-2050 | Annual Change 2019-2050 |
|---|---|---|---|---|---|
| Natural gas and other fossil products | 153,334 | 72% | 0 | 54% | 1% |
| Crude petroleum | 59,325 | 28% | - | 64% | 2% |
| Gasoline | 1,100 | 1% | - | -46% | -2% |
| Fuel oils | 456 | 0% | - | -33% | -1% |
| Fertilizers | 98 | 0% | +1 | 150% | 3% |
| Nonmetallic minerals | 68 | 0% | -1 | 49% | 1% |
| Nonmetal min. prods. | 29 | 0% | - | 59% | 2% |
| Basic chemicals | 15 | 0% | - | 284% | 4% |
Approximately 76% of pipeline crude petroleum in Minnesota in 2050 will be imported from Canada. However, natural gas and other products imports from Canada will account for just 2% of pipeline flows, as 27% (41 million tons) will be natural gas from Minnesota to Iowa and 22% (34 million tons) internal Minnesota flows. South and North Dakota will be the top two origin states for natural gas pipeline flows for a total of 48 million tons. Table 4-11 show the value of the top ten commodities moved by pipeline.
Table 4-11: Major Pipeline Commodities Value, 2050
| Commodity | Million USD (2050) | Percent | Rank Change (2019-2050) | Total Change | Change 2019-2050 |
|---|---|---|---|---|---|
| Natural gas and other fossil products | 28.540 | 59% | - | 53% | 1% |
| Crude petroleum | 19,040 | 39% | - | 90% | 2% |
| Gasoline | 493 | 1% | - | -47% | -2% |
| Fuel oils | 212 | 0% | - | -34% | -1% |
| Fertilizers | 31 | 0% | - | 144% | 3% |
| Nonmetallic minerals | 8 | 0% | - | 49% | 1% |
| Nonmetal min. prods. | 3 | 0% | - | 59% | 2% |
| Basic chemicals | 0.5 | 0% | - | 284% | 4% |
Comparison with the Previous Freight Plan
The freight flows in the 2018 Minnesota Statewide Freight System and Investment Plan were estimated with FAF 3.5 which utilized a 2007 base year with synthesized 2012 values and a 2040 forecast. Additionally, rail flows were estimated from the STB 2012 Confidential Carload Waybill Sample. Since FAF 3.5 and STB 2012 Confidential Carload Waybill Sample are no longer available, this chapter compares base 2012 FAF 4 flows which utilized a 2012 base year with FAF 5 2019 and 2050 forecast.
As seen in Table 4-12, Minnesota freight flows have increased 16% between FAF 4 2012 data and FAF 5 2019. However, a shift in the modal split is evident as rail is no longer the mode with the second highest tonnage in 2019 as it dropped 33% and pipeline, with a 26% increase, has surpassed it. This rail drop is attributed to three main commodities. Metallic ores tonnage has declined 23 million tons or -57%, coal 11.5 million tons and -49% and cereal grains 9.6 million tons and -31%. Pipeline, on the other hand, has increased mainly because of natural gas and other fossil products that increased by 30 million tons and 43%.
Table 4-12: FAF 4 - FAF 5 Tonnage Modal Split
| Description | Million Tons 2012 | Million Tons 2019 | Million Tons 2050 |
|---|---|---|---|
| Truck | 349 | 443 | 657 |
| Rail | 137 | 92 | 89 |
| Pipeline | 110 | 139 | 214 |
| Multiple modes & mail | 26 | 47 | 50 |
| Water | 19 | 17 | 23 |
| Air (include truck-air) | 0 | 0 | 1 |
| Other and unknown | 0 | 3 | 5 |
| Sum | 641 | 741 | 1,039 |
In terms of value of freight moving within Minnesota, the modal split has not changed between FAF 4 and FAF 5 as seen in Table 4-13. The total value of freight in Minnesota grew 3% with air growing 50% with the highest increase in the value of precision instruments ($6 billion), truck grew 10% with highest increase in pharmaceuticals ($11.3 billion) and mixed freight ($8.5 billion) and multiple modes and mail increased 8% because of precision instruments ($1.4 billion) and motor vehicles ($2 billion). Pipeline dropped 28% mainly because of crude which had a 51% decline in the per ton value, rail dropped 54% with highest drop in cereal grains ($4.8 billion) and water dropped 63% which declined for most commodities.
Table 4-13: FAF 4 - FAF 5 Value Modal Split
| Description | Billion USD 2012 | Billion USD 2019 | Billion USD 2050 |
|---|---|---|---|
| Truck | 324 | 357 | 674 |
| Multiple modes & mail | 82 | 88 | 179 |
| Pipeline | 42 | 30 | 48 |
| Rail | 37 | 17 | 23 |
| Air (include truck-air) | 15 | 23 | 50 |
| Water | 3 | 1 | 2 |
| Other and unknown | 0 | 0 | 2 |
| Sum | 504 | 517 | 978 |
Table 4-14 illustrates the top 10 commodities in Minnesota in FAF 4 2012 base data and the change in FAF 5 2019 and 2050 findings by tonnage. Coal and metallic ores have dropped 49 and 27% respectively. On the other hand, natural gas and crude petroleum, both commodities moving primarily via pipeline in Minnesota, have the second highest increase (41%), after gravel which increased 57%.
Table 4-14: FAF 4 - FAF 5 Top 10 Commodities by Tonnage
| Commodity | Thousand Tons 2012 | Thousand Tons 2019 | Thousand Tons 2050 | Change 2012-2019 | Change 2019-2050 |
|---|---|---|---|---|---|
| Cereal grains | 105,987 | 114,142 | 141,860 | 8% | 24% |
| Natural gas and other fossil products | 83,679 | 117,956 | 169,525 | 41% | 44% |
| Metallic ores | 61,577 | 44,969 | 33,124 | -27% | -26% |
| Gravel | 44,262 | 69,500 | 106,464 | 57% | 53% |
| Other ag prods. | 41,596 | 44,144 | 62,194 | 6% | 41% |
| Nonmetal min. prods. | 38,540 | 34,460 | 51,521 | -11% | 50% |
| Crude petroleum | 31,100 | 43,787 | 59,655 | 41% | 36% |
| Other foodstuffs | 29,815 | 25,035 | 38,629 | -16% | 54% |
| Coal | 23,606 | 11,973 | 2,829 | -49% | -76% |
| Animal feed | 21,295 | 27,688 | 54,187 | 30% | 96% |
| All Other | 159,943 | 206,851 | 319,351 | 29% | 54% |
Electronics was the highest commodity by value moved in Minnesota both in 2012 and 2019 but will be overpassed by mixed freight and precision instruments by 2050 as seen in Table 4-15. The highest decrease was in cereal grains value, dropping 37% from 2012 to 2019, followed by other foodstuffs at -16% and natural gas which despite its tonnage increase has dropped 1% because of its lower per ton value in 2019 ($208 versus $296 in 2012).
Table 4-15: FAF 4 - FAF 5 Top 10 Commodities by Value
| Commodity | Million USD 2012 | Million USD 2019 | Million USD 2050 | Change 2012-2019 | Change 2019-2050 |
|---|---|---|---|---|---|
| Electronics | 41,114 | 43,794 | 79,259 | 7% | 81% |
| Mixed freight | 32,331 | 41,556 | 81,037 | 29% | 95% |
| Machinery | 30,268 | 34,485 | 60,682 | 14% | 76% |
| Other foodstuffs | 25,765 | 21,639 | 33,510 | -16% | 55% |
| Natural gas and other fossil products | 24,761 | 24,495 | 33,730 | -1% | 38% |
| Motorized vehicles | 24,724 | 30,210 | 51,639 | 22% | 71% |
| Precision Instruments | 23,091 | 32,088 | 80,313 | 39% | 150% |
| Cereal grains | 22,685 | 14,380 | 18,050 | -37% | 26% |
| Misc. mfg. prods. | 21,752 | 24,579 | 63,011 | 13% | 156% |
| Plastics/rubber | 18,399 | 22,602 | 54,171 | 23% | 140% |
| All Other | 238,758 | 226,886 | 422,900 | -5% | 86% |