Minnesota's Freight System Assets, Conditions and Performance
Minnesota’s multimodal freight system is made up of highways, railroads, waterways, airports and pipelines. The system is integrated by intermodal connectors that allow decision-makers to transfer goods and commodities from one mode to another.
To some degree the freight mode compete for market share, but to a much larger degree the freight modes complement each other—all modes are needed. Supply chain managers balance the needs of freight transportation costs and customer service in deciding which freight modes to use. The conditions and performance of all these systems impacts the efficiency, reliability and safety of freight movement throughout the state.
Overview
The freight transportation systems in Minnesota are well-suited for efficiently moving a wide variety of goods and services. This includes heavy bulk goods shipped from Mississippi River ports, lightweight precision medical devices flown across the globe and sugarbeets transported from piling grounds to processing factories via truck. Minnesota also has an interconnected road network that links trucks to light industries and intermodal facilities, providing connections to neighboring states and Canada. Key roadways, such as I-94 and US-75, facilitate high levels of truck traffic and connect to important facilities and retail nodes. Additionally, Minnesota is served by four Class I railroads connecting to grain terminals and metallic ores from the Mesabi Iron Range. The state also benefits from access to two commercially navigable water systems that connect to the Gulf of Mexico and the Eastern Seaboard. Minnesota is home to 14 cargo service airports, which handle the distribution of electronic components and time-sensitive materials. Furthermore, Minnesota has a robust network of pipelines, carrying 30% of the nation’s crude oil.
Minnesota must continue to maintain and modernize its extensive freight system. Continuous investments are necessary to ensure that the freight network supports consumers and shippers by enabling timely delivery of goods and services, improving supply chain efficiency and enhancing the safety and mobility of the multimodal freight system. Each section provides a high-level overview of individual freight modes and their importance to the overall network, allowing for further assessment and infrastructure funding.
Figure 3-1: Minnesota Multimodal Freight System
Highway Network
Compared to other freight modes, the highway freight network requires the largest footprint but provides the most direct means of access to the freight system for most homes and businesses. In Minnesota, nearly two-thirds of all freight is carried by truck and trucks play a crucial role in connecting shippers with other transportation modes, often carrying smaller volumes of goods compared to rail and pipelines. While road networks have low barriers to entry, they also come with high operations maintenance costs, including pavement repair, snow plowing and other upkeep.
Highway Network Snapshot
- National Primary Highway Freight System: 812 miles
- Critical Urban Freight Corridors: 91.44 miles designated
- State Primary Freight System (NHS): 3,888 miles
- Strategic Highway Network (STRAHNET): 3,180 miles
- Other Interstate Highways: 219 miles
- Critical Rural Freight Corridors: 177.6 miles designated
- National Network: 18,947 miles
- I-694 in the Twin Cities Metro has the highest average daily truck volumes at: 12,913
Top 3 Commodities by Tonnage:
- Cereal Grains: 87 million tons
- Gravel: 65 million tons
- Agricultural Products: 39 million tons
Top 3 Commodities by Value:
- Machinery: $27 billion
- Electronics: $23 billion
- Motorized Vehicles: $22 billion
Minnesota has three major interstate highways: I-35, I-94 and I-90 and the 4th largest public road system in the nation. I-35 is a significant north-south route that extends from Duluth to the US-Mexico border. It serves as a heavily used freight corridor for trucks, making it an essential part of the interconnected freight network. I-35W experiences the highest truck traffic in the Twin Cities. It provides a link to Duluth-Superior. I-94 is an important east-west corridor that stretches from Port Huron, Michigan, to its western terminus in Billings, Montana. The route travels through Minneapolis and intersects with major routes, including I-35E, I-35W and I-90, which experience high levels of traffic. I-94 continues west through Sherburne and Stearns counties, which account for 17% of all traffic and serve as a major corridor for retail-trade businesses. Finally, it connects Fergus Falls and Alexandria, with significant concentrations of critical agriculture, construction and manufacturing sectors. I-90 is a crucial east-west route that spans over 3,000 miles from Boston to Seattle, WA. The route starts at the border of Wisconsin and ends in South Dakota. The eastern portion of the state has two major junctions: US 52 and I-35. I-35 has the largest truck parking supply in the state. This interstate passes through several communities and provides access to agricultural and industrial areas.
Why does so much freight move by truck and not other modes? A common question from State Freight Plan engagement efforts was, “Why can’t more freight be moved by rail or other modes?” The simple answer is that no other mode can compete with trucking in terms of accessibility and simplicity of shipping. Especially for distances less than 500 miles, the logistics of transporting goods via rail, water, air, or other modes can be costly and inefficient. Nearly all homes and businesses in Minnesota have a direct connection to the freight roadway network, meaning that even if other modes are used, most freight trips start and end with truck delivery.
Key Designated Freight Networks in Minnesota
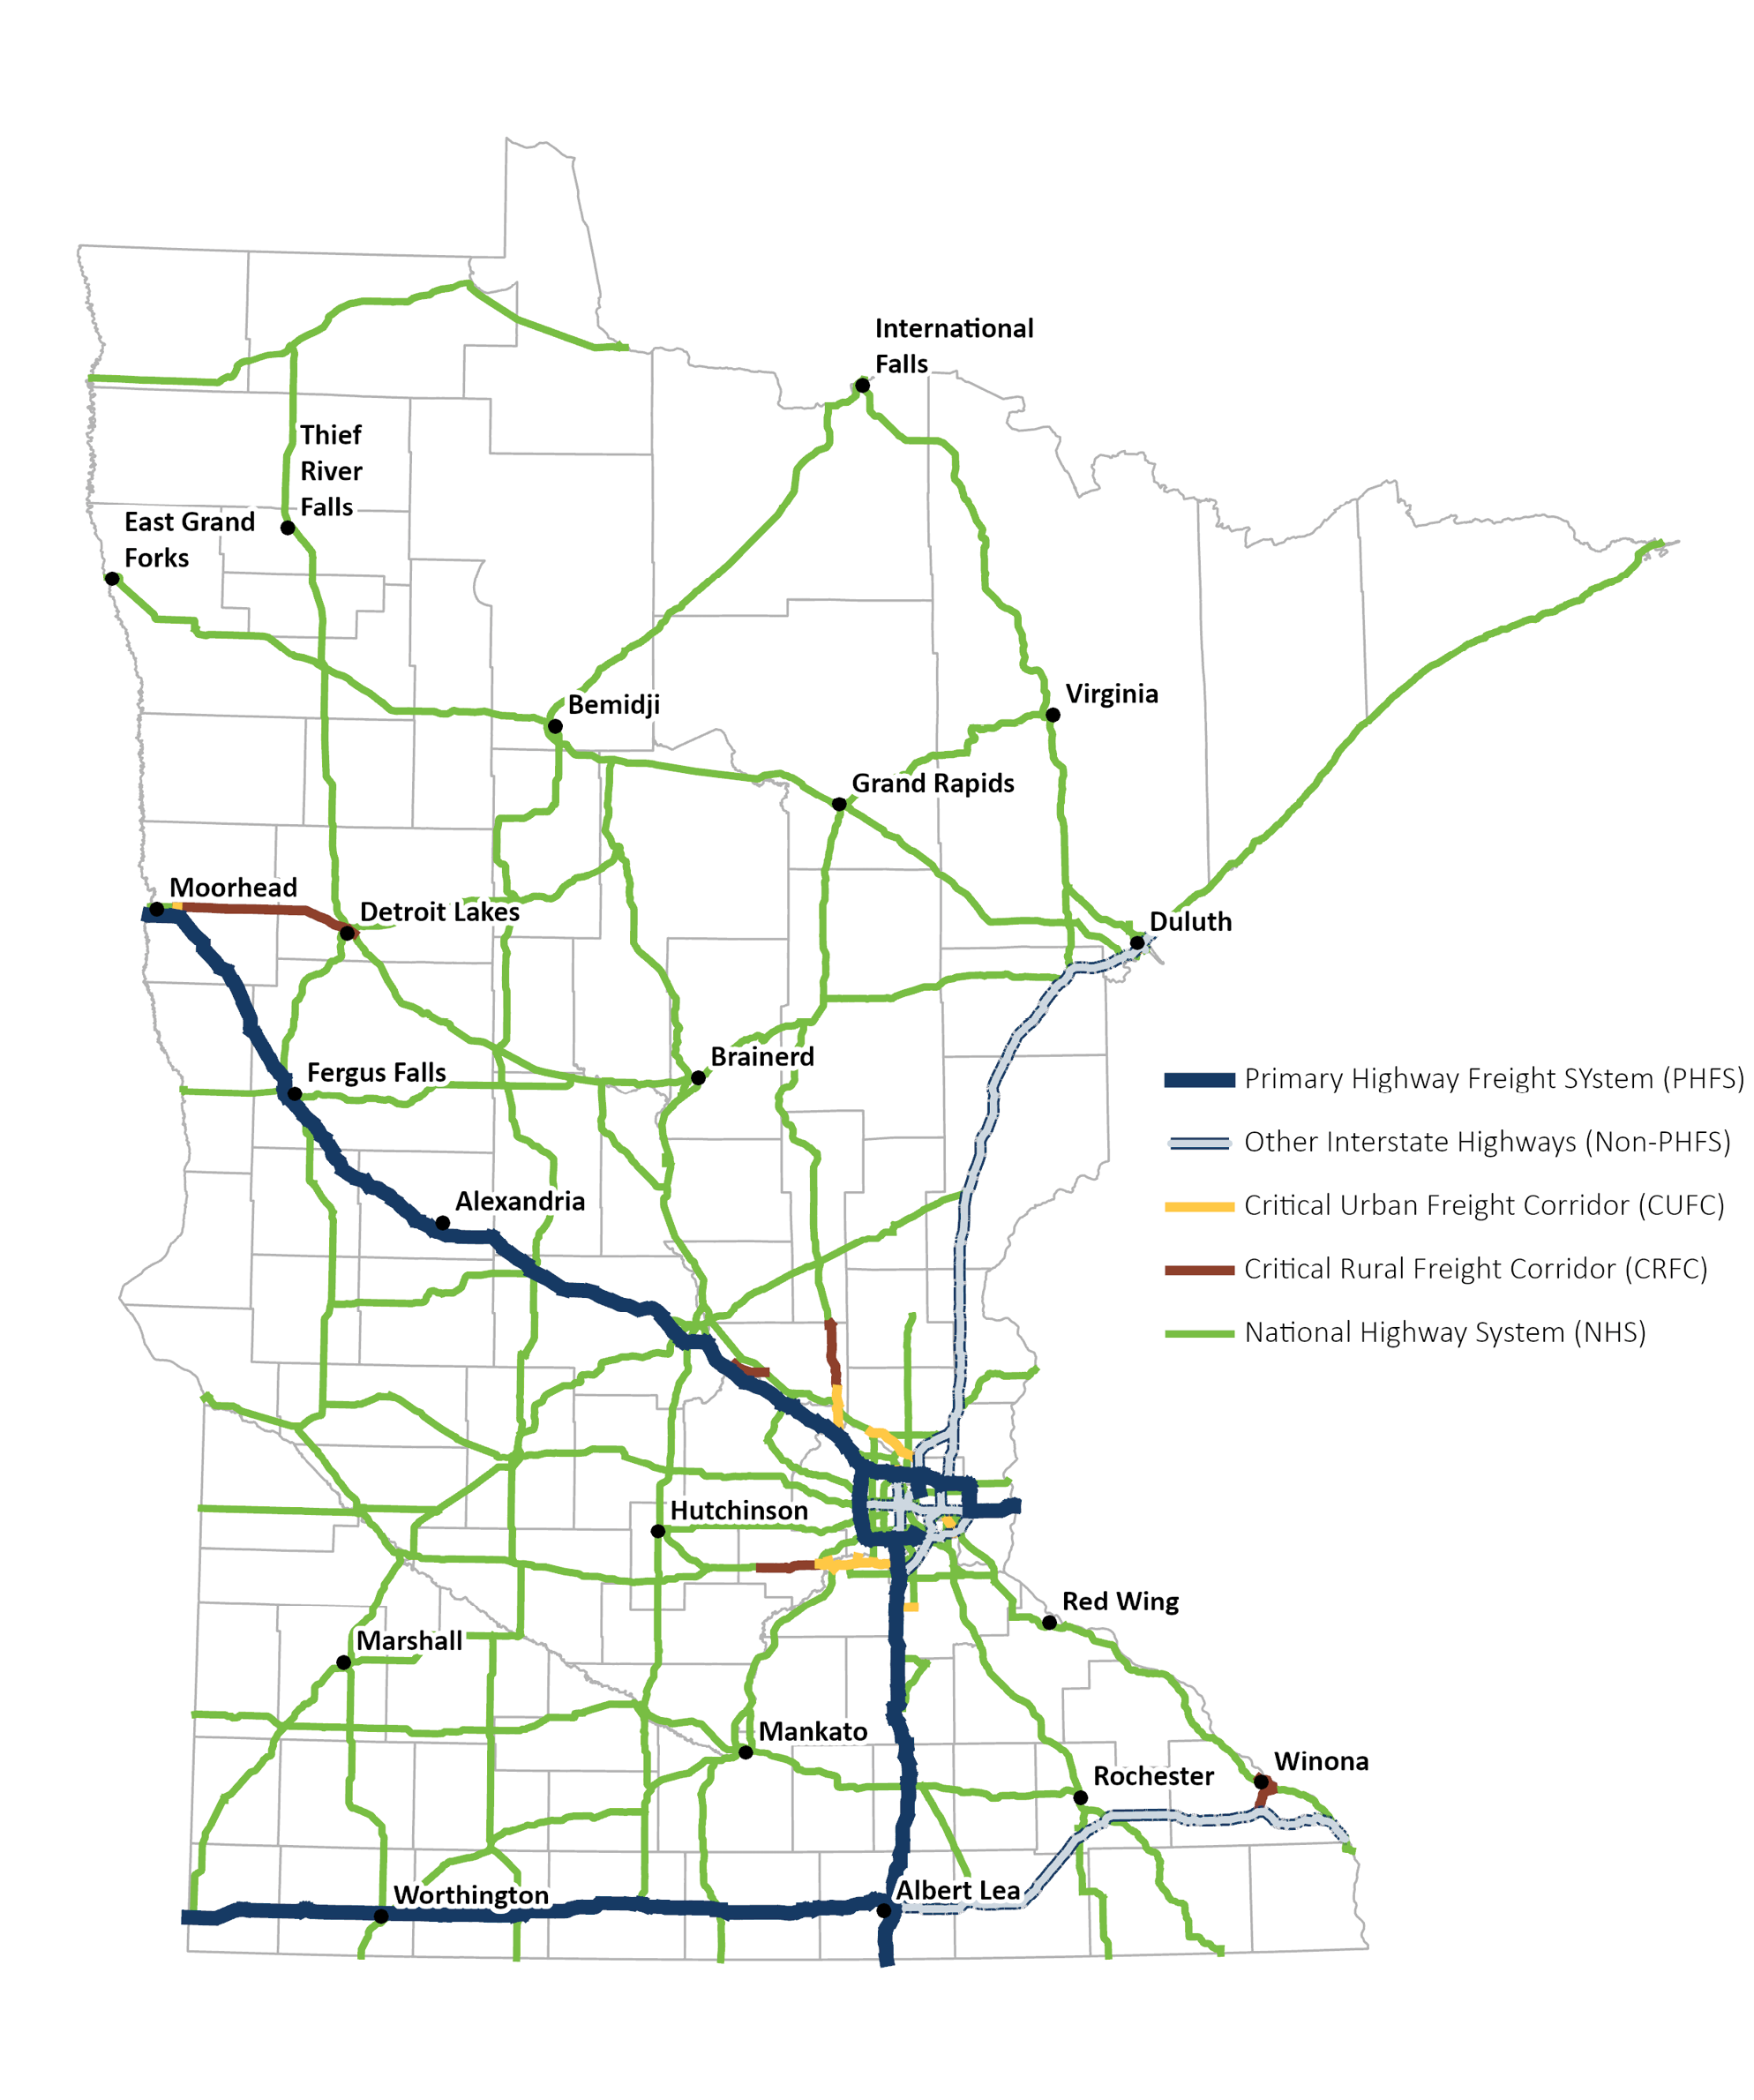
A number of roadways in Minnesota are included on designated federal and state freight networks. A brief description of these networks is provided below:
- Primary Highway Freight System (PHFS): The PHFS is the primary component of the National Highway Freight Network (NHFN). This network, established by the FAST Act, helps strategically direct resources toward improved system performance for efficient freight movement on highways. Based on an FHWA assessment of average daily heavy commercial traffic volumes, the PHFS is a network of highways identified as the most critical highway portions of the U.S. freight transportation system. Minnesota’s highway network includes 913 centerline miles of Interstate highways, of which 590 miles is designated as PHFS. Notable segments of the Interstate highways in Minnesota include I-35 from the Iowa border to the confluence of I-35W and I-35E, I-35/I- 35W south of I-494, a portion of I-35W south of I-694, I-694 between connections with I-94, I-494 between I-94 and the MSP Airport, the entirety of I-94 from North Dakota to Wisconsin (except for the segment from I-394 to I-694) and I-90 from the South Dakota border to I-35 in Freeborn County.
- Other Interstate non on the PHFS: All Interstate highways not included in the PHFS in Minnesota are also considered to be part of the NHFN. These highways, known as Non-PHFS routes, are essential for ensuring continuity and access to freight transportation facilities.
- National Highway System (NHS): This network of roadways has been identified for their importance to the nation’s economy, defense and mobility and includes Interstate highways and other Principal Arterials that provide access between population centers and notable transportation features such as airports, water ports and other intermodal transportation facilities. Notably for Minnesota, the extents of the NHS have been used to designate the State’s Primary Freight Network.
A strong truck network allows a company to reduce shipping costs and enhance service levels with minimal disruption to operations. However, traffic congestion on highways and at major intersections can lead to delays in truck movement, resulting in delivery delays. Heavy Commercial Annualized Average Daily Traffic (HCAADT) provides insight into daily truck traffic volume and identifies areas with the highest levels of truck traffic. The Twin Cities sees the highest level of traffic. I-694 has the highest average value of 12,913 trucks per day with a range between 5,577 and 18,838. The highest truck volumes are experienced on I-35W, north of Highway 62.
Other high truck volume segments include I-35W south of I-94, I-35 south of I-494, I-94 west of I-694 and I-694 in the north metro. (Figure 3-3). Outside of the Twin Cities, I-94 sees high levels of truck traffic near Monticello and St. Cloud, with over 20,000 trucks per day. Additionally, at the North Dakota border entering Fargo, there are nearly 12,000 trucks per day. Along I-90, the interchange at I-90 and US Highway 52 has upwards of 9,000 trucks per day. Finally, I-35 experiences steady truck traffic from the Iowa border to the Twin Cities.
HCAADT and Truck Bottlenecks
The heavy commercial annual average daily traffic count (HCAADT), commonly referred to as daily truck volumes, for the state of Minnesota are shown in Figure 3-4. The highest concentration of daily truck activity is on the Interstate system, particularly on I-94, I-694, I-494, I-35E and I-35W in the Metro District. The highest recorded daily truck volume in the state is on I-35W in Minneapolis north of Diamond Lake Road. This roadway segment experiences approximately 31,000 trucks per day. Other high truck volume roadways in Greater Minnesota include US 169, US 52, US 14 in southeast Minnesota, US 10 east of Fargo and US 53 north of Duluth. MnDOT’s Traffic Mapping Application provides free access to traffic count data for state highways and local roads.
In compliance with federal requirements, MnDOT routinely measures and reports on the locations of truck bottlenecks, defined as two or more contiguous segments of roadway, each of which meets the minimum threshold of 4 hours of truck delay per day per mile for at least one of three time periods: morning peak, midday peak, evening peak. The truck bottlenecks identified in the 2023 report are summarized in Table 3-1 and shown in Figure 3-2 below.
Table 3-1: List of Minnesota 2023 Truck Bottlenecks
| Interstate Bottlenecks | Non-Interstate Bottlenecks |
|
|
Figure 3-2: List of Minnesota 2023 Truck Bottlenecks
Figure 3-3: Heavy Commercial Annual Average Daily Traffic
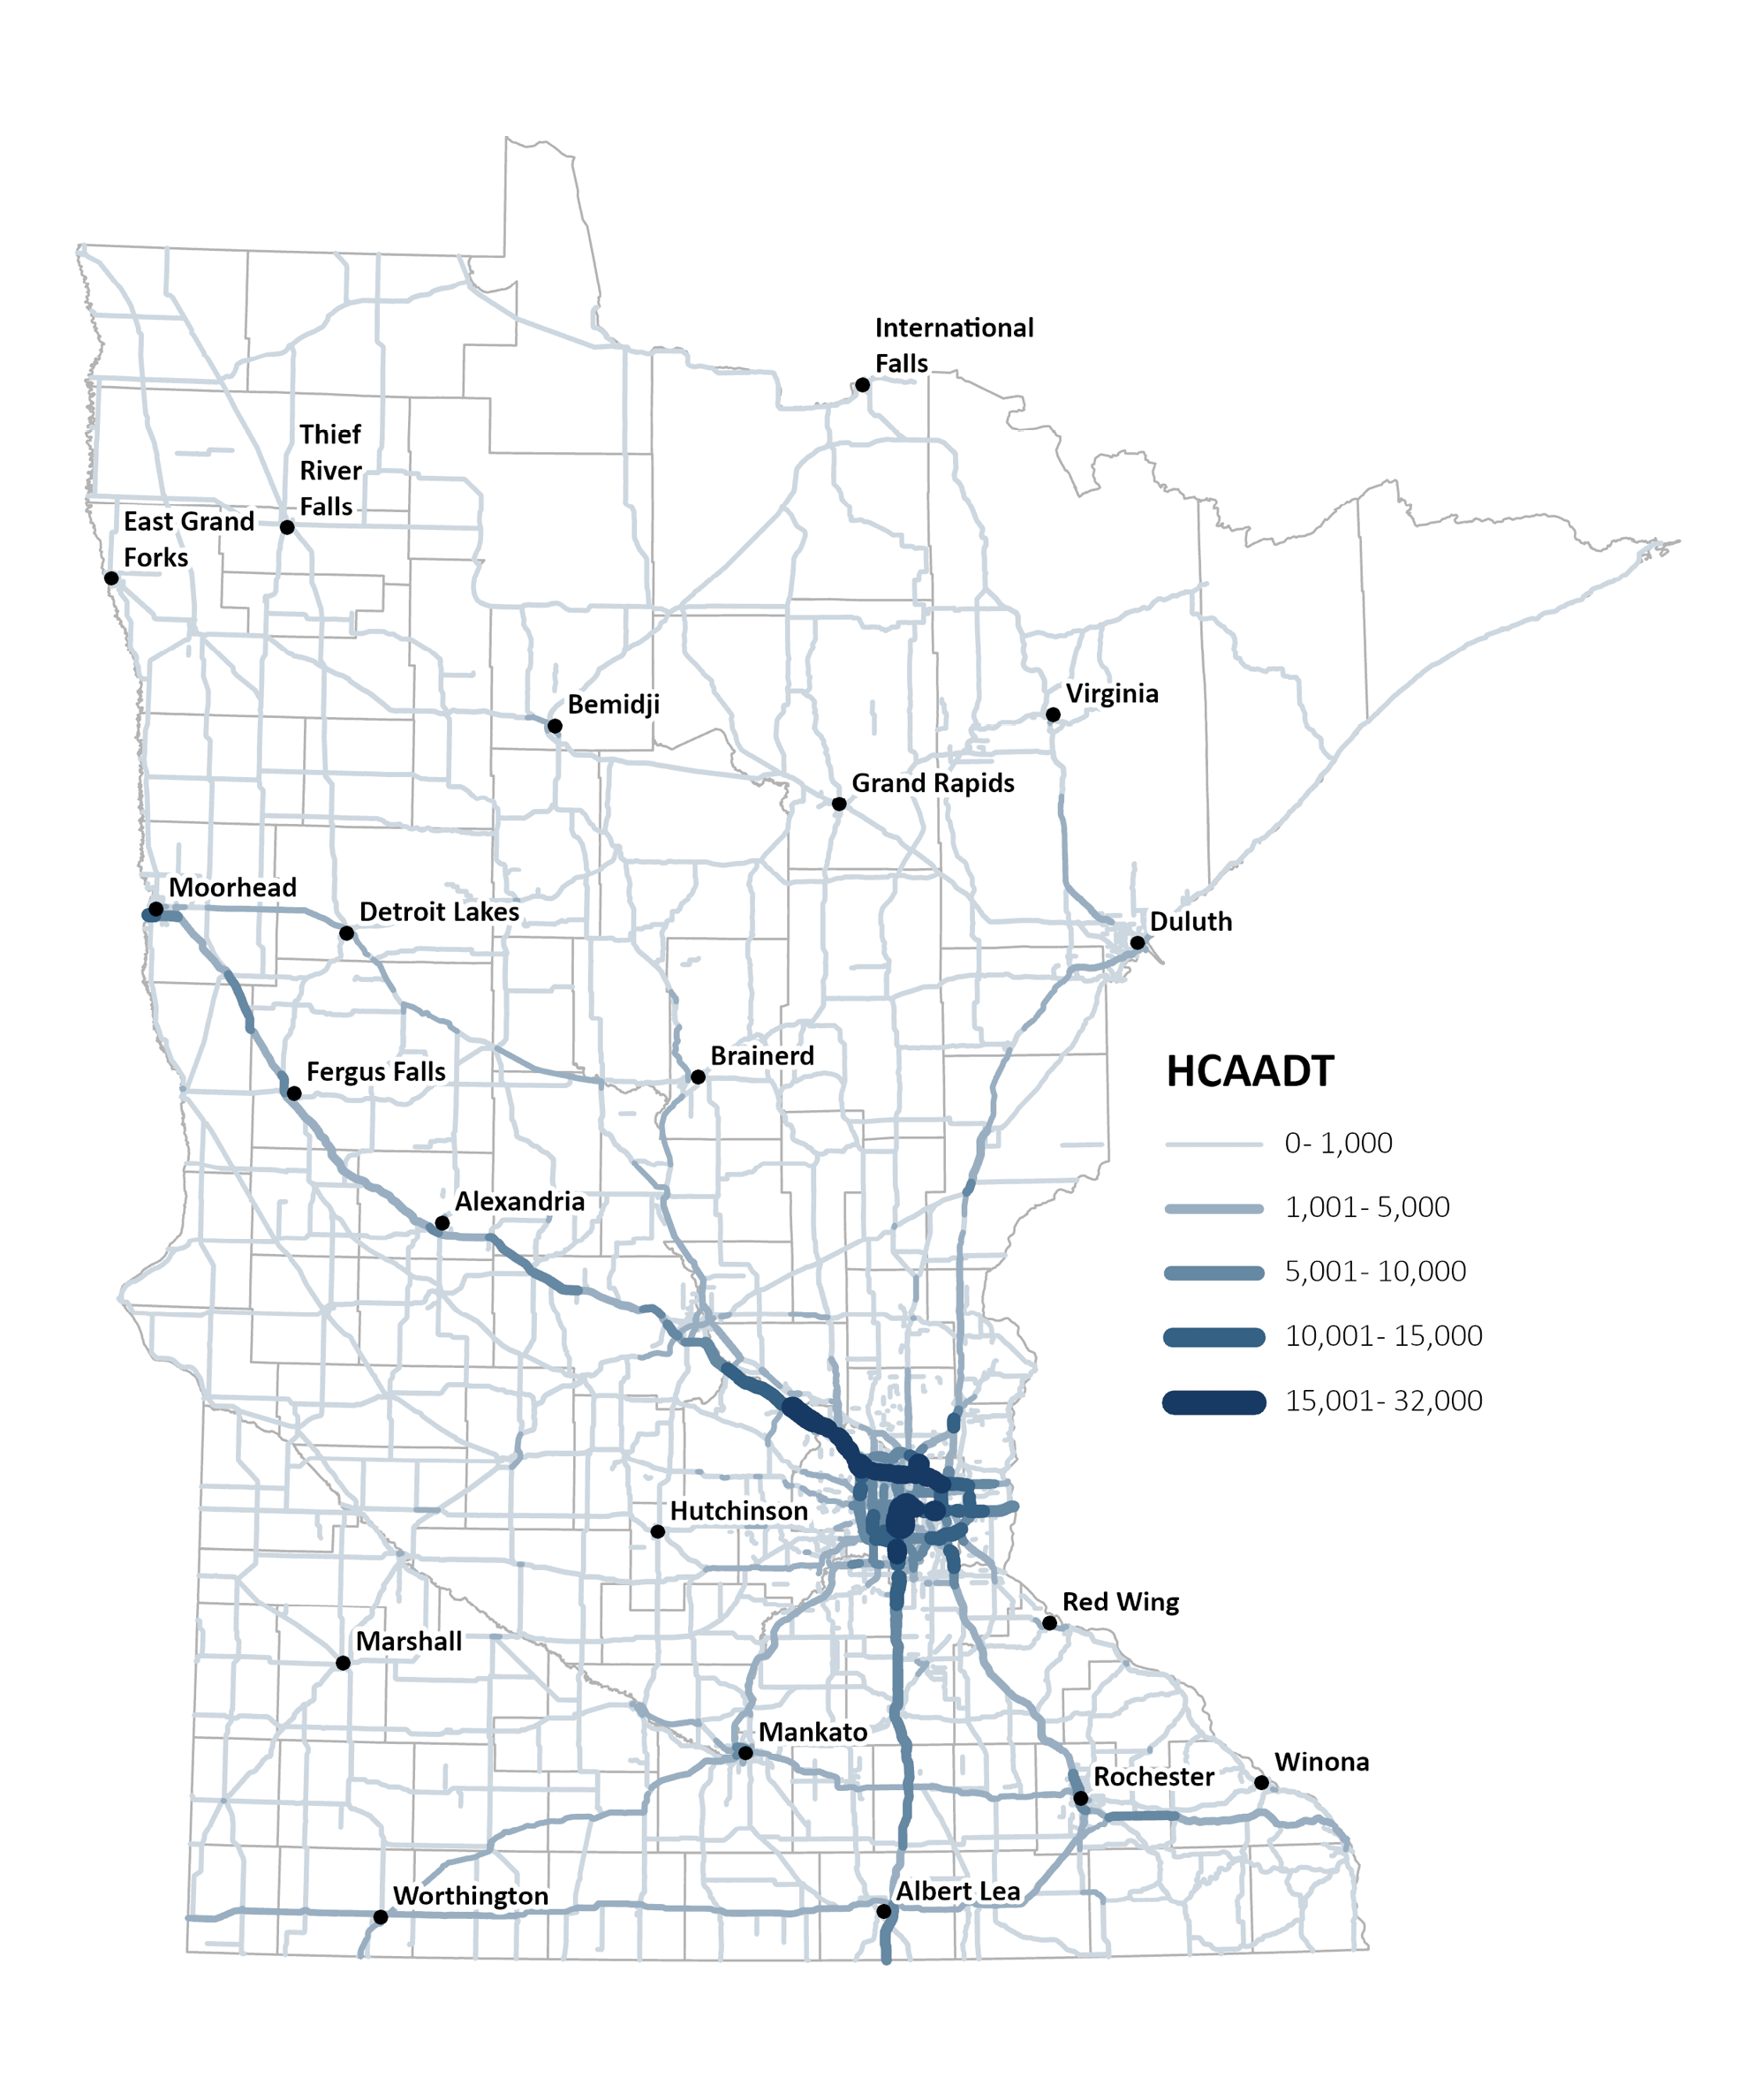
Figure 3-4: Designated Highway Freight Networks in Minnesota
Reliability
The smooth and predictable movement of freight on the highway system is crucial for ensuring on-time deliveries and reduction of congestion. In addition to traditional congestion measures, one of the ways that MnDOT measures reliability is through the Truck Travel Time Reliability Index (TTTRI). This is a federally defined measure calculated as the ratio between the slowest truck travel times (95th percentile) and the average truck travel times (50th percentile). A TTTRI ratio of 1.0 indicates that the travel time on the roadway is very reliable and never deviates from the average time. A TTTRI ratio of 2.0 indicates that the truck travel time during the slowest conditions is twice as slow as during the average conditions. TTTRI hotspots in Minnesota are largely concentrated in the Twin Cities metro, particularly on portions of I-94, I-694 and I-494.
Pavement Condition
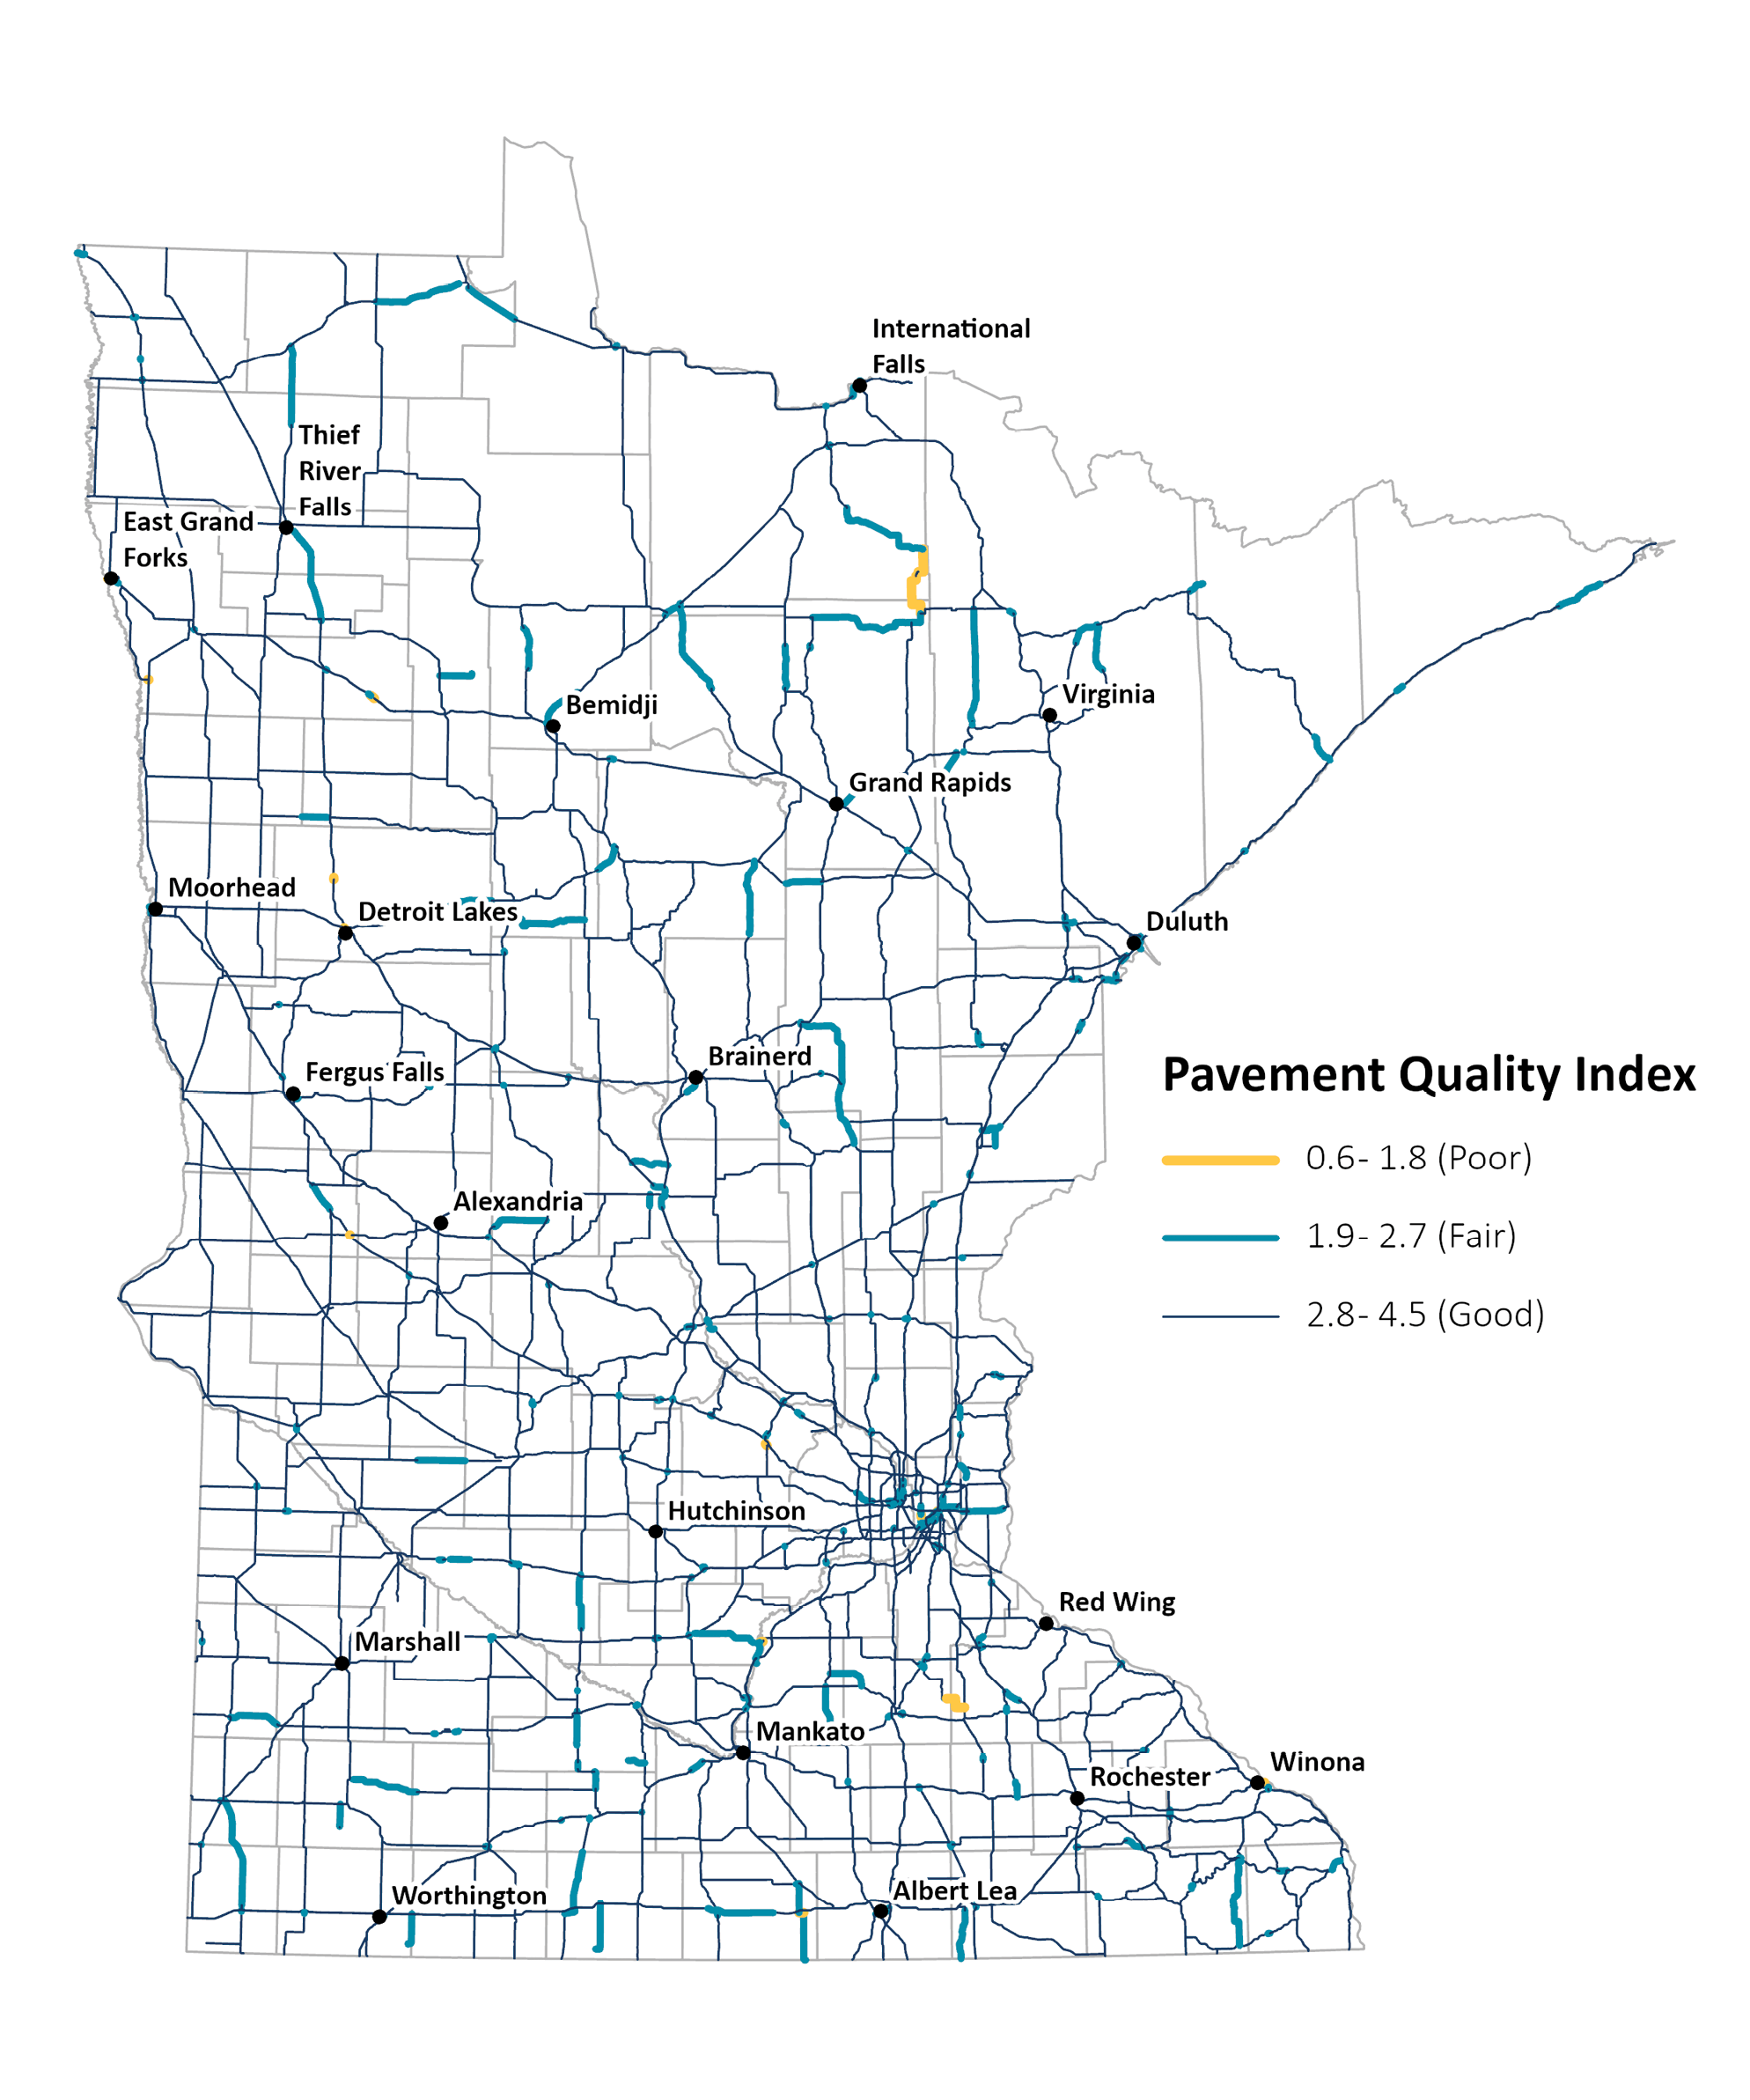
Pavement that is maintained in good condition has a variety of benefits including improved safety, reduced wear and tear on vehicles and cargo and reduced roadway congestion. MnDOT has many different measures for assessing the evaluating pavement data. One of these is the Pavement Quality Index (PQI) which is calculated as a composite measure of both ride quality and overall surface condition. The resulting PQI measure is a number between 0 and 5. A PQI of 2.8 and above indicates “good” pavement condition while a PQI less than 1.8 is considered to be “poor” pavement condition. A PQI between 1.9 and 2.7 is considered to be in “fair” condition. The vast majority (93.7%) of Minnesota’s trunk highway system is considered to be in good condition while only 0.1% of the system is considered to be in poor condition. The longest stretch of pavement in poor condition is MN 65 in northern Minnesota. This single stretch of road accounts for nearly 90% of the roads in poor condition. Other locations of roadways in poor condition are typically shorter segments spread throughout the state.

Figure 3-5: Truck Travel Time Reliability
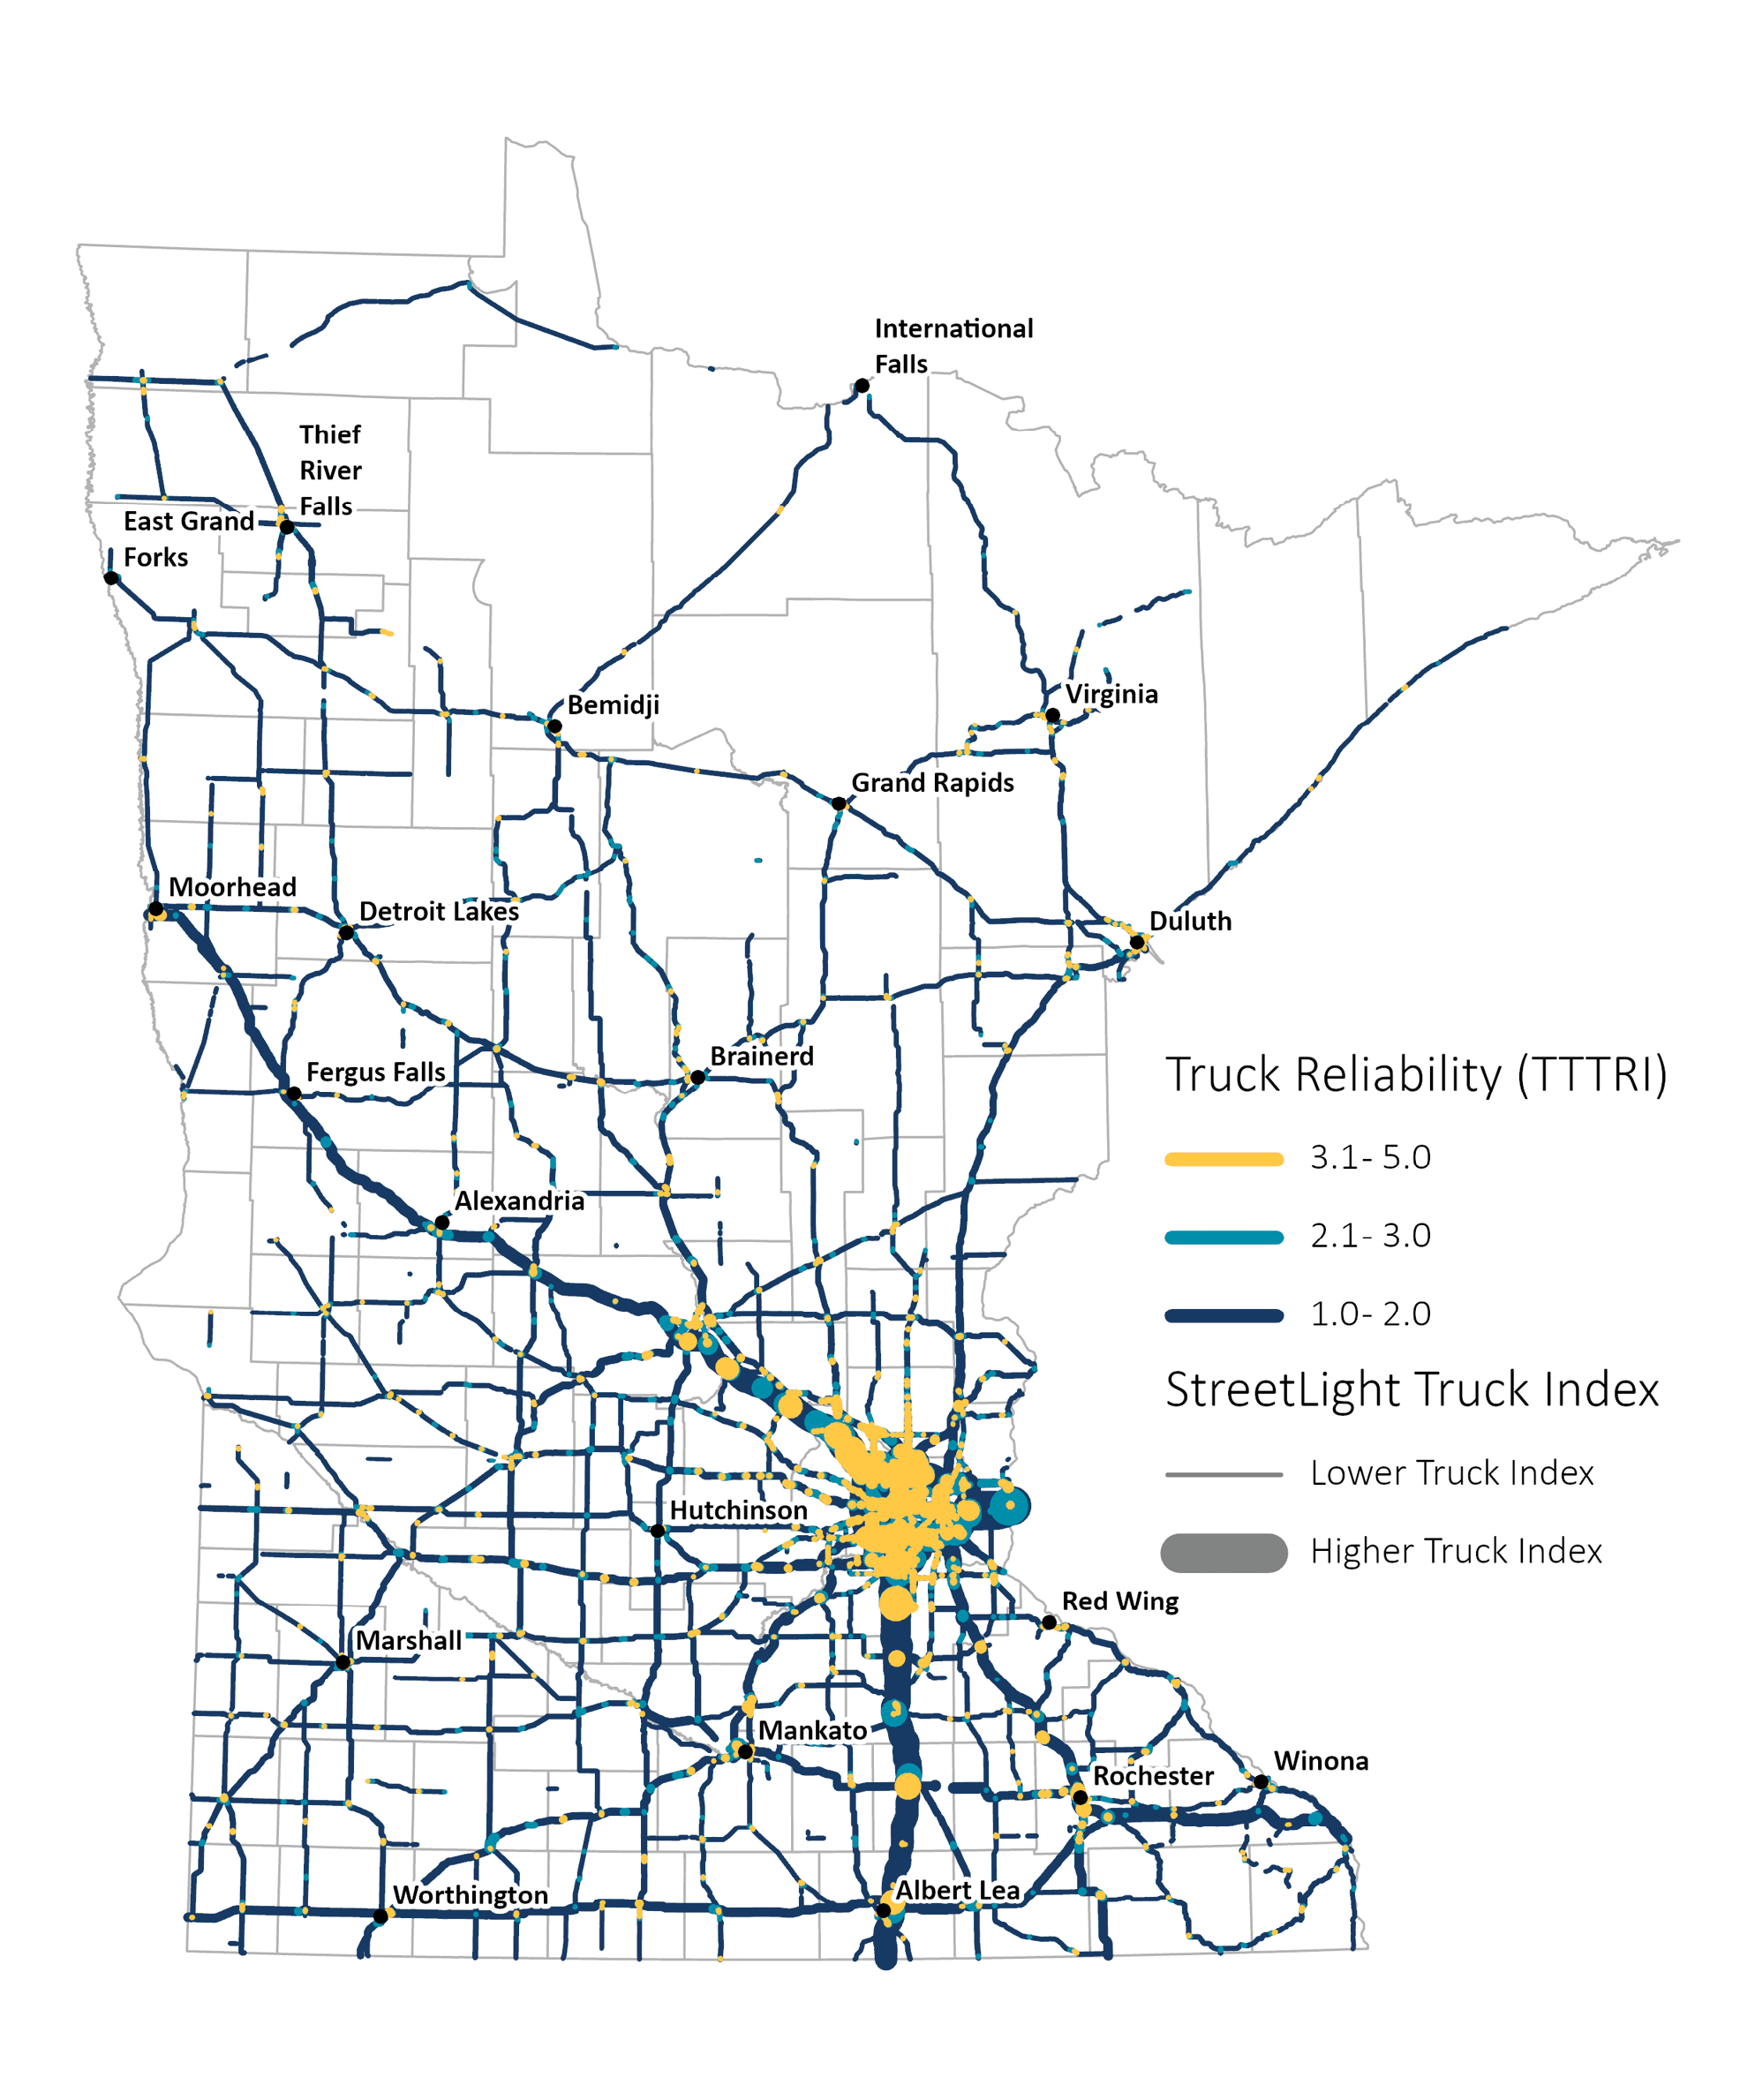
Figure 3-6: Pavement Condition (2022)
Truck Parking
Trucks are responsible for moving more than 73% of the nation’s goods by value and the amount of freight moved by truck is expected to continue to increase over the next 25 years. The lack of available truck parking is one of the primary concerns for truck drivers. More readily available parking can help drivers avoid violations related to federal hours of service regulations but is also important for ensuring driver safety.
Truck Parking Snapshot
- 212 parking facilities
- 49 public parking facilities
- 163 private parking spaces
- 4,266 total parking spaces
- 665 total public truck parking spaces
- 4,169 total private truck parking spaces
- 85% is private truck parking
- 98% of truck drivers struggle to find safe and sufficient parking
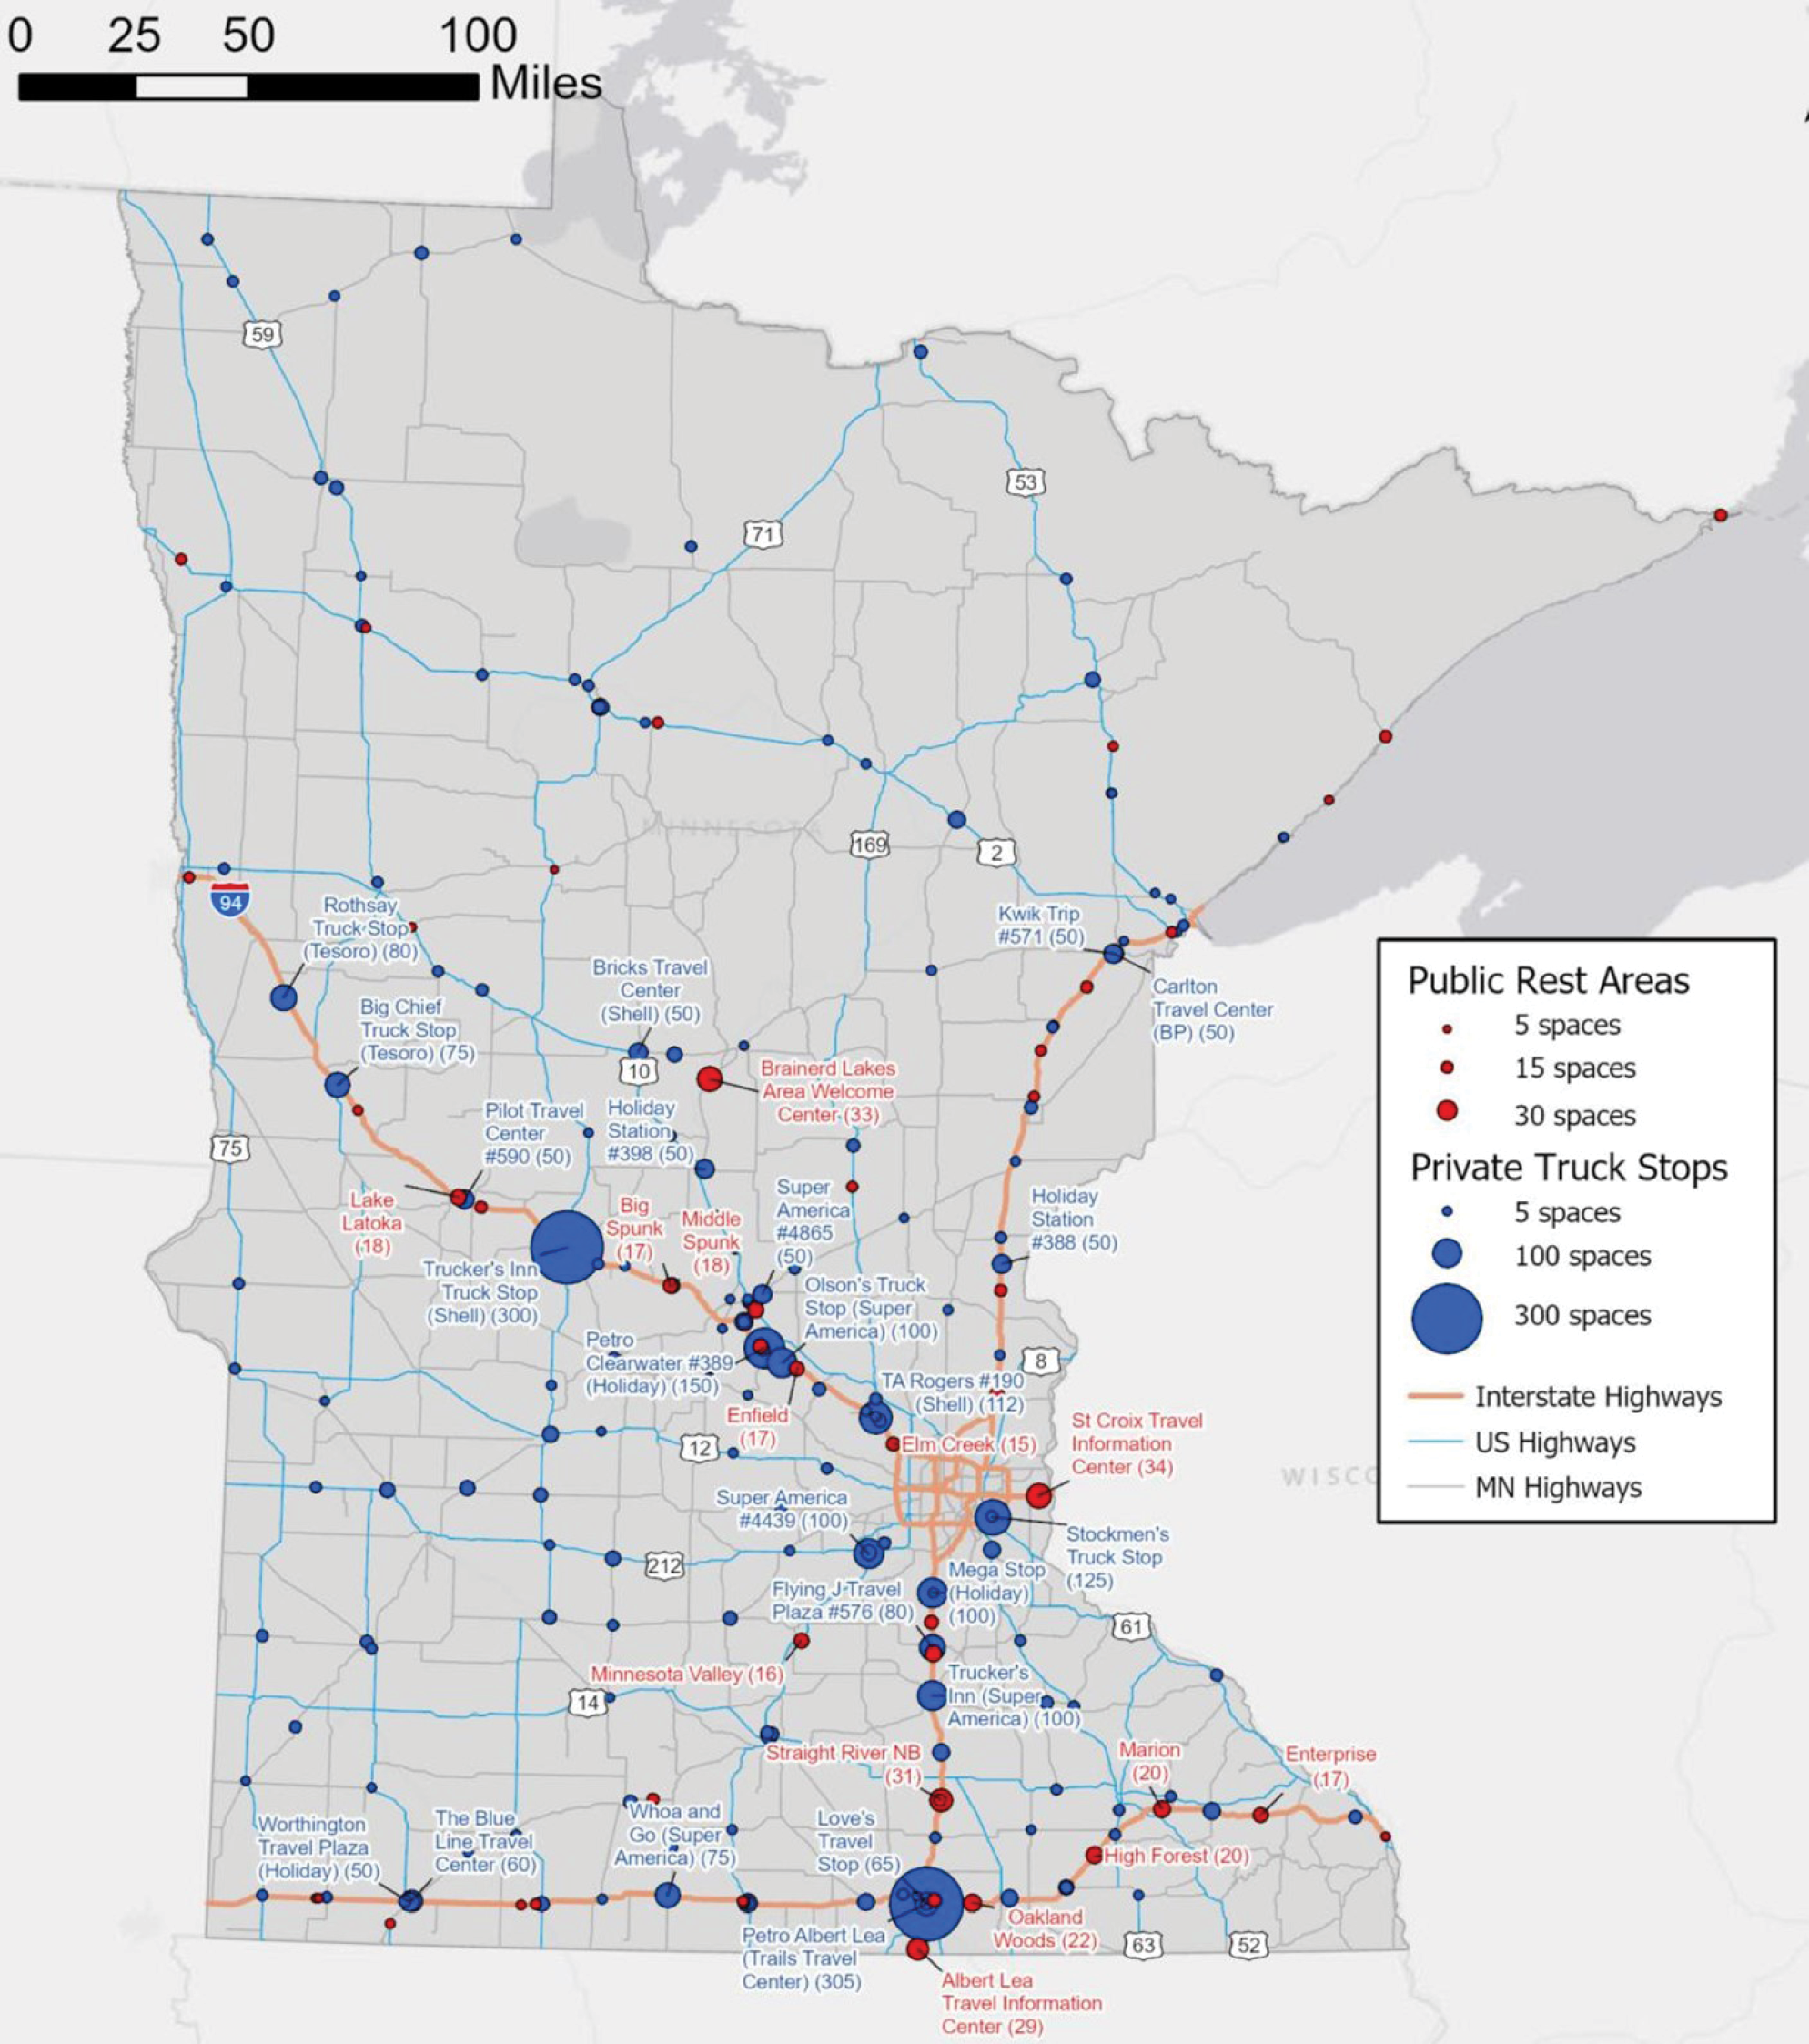
Minnesota conducted a Statewide Truck Parking Study in 2019. This study found that there are a total of 212 parking facilities, with 49 being public rest areas and 163 being private truck stops. These facilities offer approximately 4,834 parking spaces for trucks, with 665 of these spaces located at public facilities and 4,169 at private truck stops. The study calculated estimated truck parking demand using truck probe data from the American Transportation Research Institute (ATRI) and using the StreetLight Insight platform. The study found that many parking facilities in the state routinely meet or exceed their truck parking capacity. This can result in unsafe behavior such as truck parking on freeway on and off ramps or in otherwise unsafe locations. Many cities in the Twin Cities metro have also enacted bans for on-street truck parking, which is compounding the truck parking availability issue.
Truck Parking Technologies
The Truck Parking Information Management System (TPIMS) program is an initiative to provide real- time truck parking information to drivers through dynamic message signs (DMS) located at strategic points across the eight-state Mid America Association of State Transportation Officials (MAASTO) region. A survey of truck drivers conducted for the Statewide Truck Parking Study revealed that over half of the respondents found the TPIMS signs on I-94 helpful in locating truck parking in Minnesota. Currently, TPIMS signs are installed on I-94 northwest of the Twin Cities metro area and on I-35 south of the Metro area. Additionally, MnDOT plans to improve truck parking in Minnesota by collaborating with local governments and land use authorities to emphasize the significance of truck parking for local and regional economies.
Figure 3-7: Truck Parking Facilities and Capacity
2019 Truck Parking study
Railroad
Heavy industries such as agriculture, mining and construction products are traditionally associated with rail transport systems for moving large amounts of cargo over large distances. This mode of transportation can be cost-effective and, in some cases, comparable in speed to truck shipping, with reliable schedules. Rail transport is also environmentally friendly, emitting fewer greenhouse gases than trucks. Rail cargo accounts for 19% of the freight tonnage moved to, from, or within Minnesota and accounts for 20% of freight value. In the past 10 years, the amount of freight shipped via traditional rail shipments has steadily declined but has been replaced by containerized intermodal service which allows for easier transport between other modes.
Railroad Snapshot
- 4,534 Total Miles of Track
- 4 Intermodal Rail Terminals
- 4 Class I railroads
- 6,278 At-grade crossings
- 1,633 Active Warning Devices
- 2,390 Passive Signage
Top 3 Commodities by Tonnage:
- Cereal Grains: 21.2 million tons
- Metallic Ores: 17.8 million tons
- Coal: 11.9 million tons
Top 3 Commodities by Value:
- Cereal Grains: $3.3 billion
- Crude Petroleum: $1.9 billion
- Other Foodstuffs: $1.4 billion
In the US, railroads are divided into three classes based on their annual revenue and geographic reach. The first class, known as Class I carriers, are those whose revenue exceeds a gross operating revenue of $447,600,000. Numbers for track miles operated in the state are sourced from the Association of American Railroads State Freight Rail Snapshot.
- BNSF Railway operates the largest amount of rail mileage in the state at 1,712 miles. BNSF’s network in Minnesota includes portions of the Northern Transcon route, moving freight between Seattle and Chicago. BNSF’s predominant commodities shipped to and from Minnesota are agricultural products, industrial goods and products, and consumer goods.
- CPKC operates the second highest rail miles in Minnesota, with 1,701 total rail miles and plays a crucial role in transporting agricultural products within the state, particularly along the Detroit Lakes subdivision, with access to 5 grain terminals in the MnDOT district and connects to the Shoreham Facility in northeast Minneapolis.
- Union Pacific (UP) operates 644 miles in the southeastern MN and Twin Cities area. The predominant commodities shipped by UP include grain, oils, biofuels, sweeteners and intermodal wholesale.
- Canadian National (CN) is the Class I railroad with the smallest amount of track operated in the state at 378 miles located primarily in the northeastern part of the state. This line is part of the major intermodal route between the Port of Prince Rupert in British Columbia and CN’s major intermodal hub in Chicago, IL.
Class II and Class III carriers are regional and short line railroads, collectively operating the third largest rail mileage in the state with 984 total rail miles, providing “first mile/last mile” freight services.
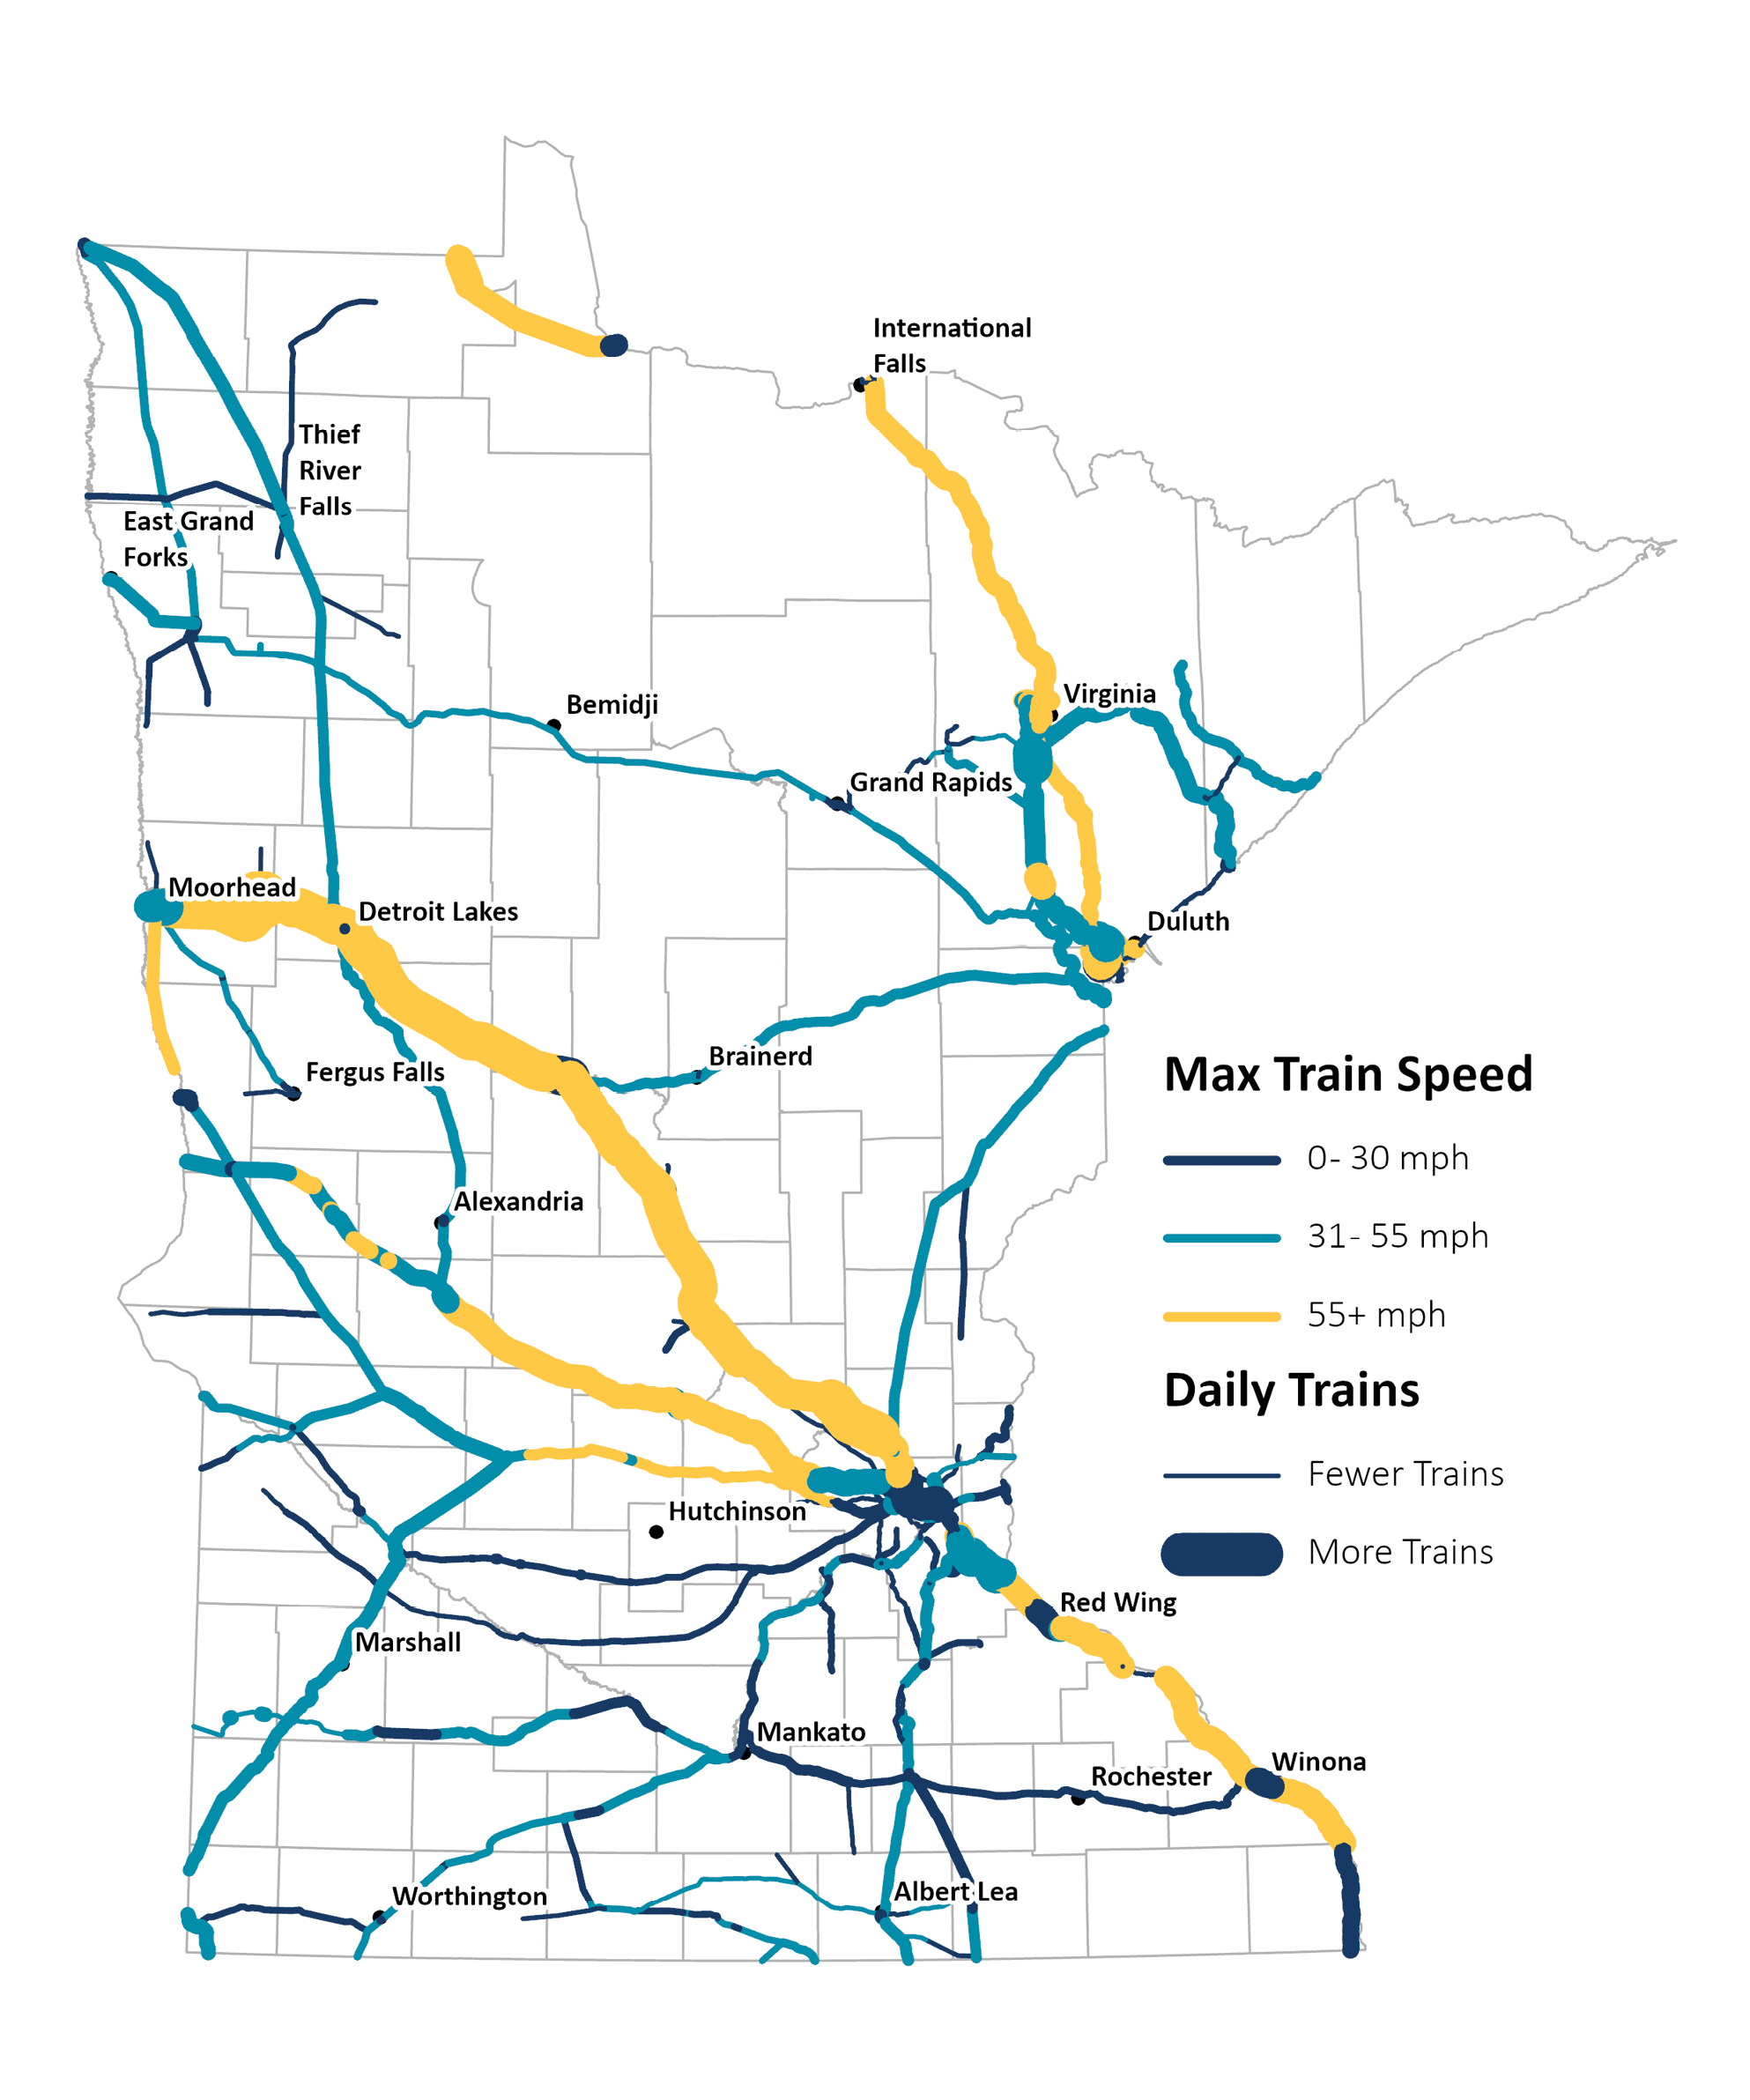
The BNSF Staples Subdivision, which connects the Twin Cities Metro with Fargo, ND and beyond is the rail corridor with both the highest volumes and the highest maximum train speeds in the state with approximately 30 trains per day at a maximum speed of 70 mph. As such, much of MnDOT’s grade crossing improvement program has focused on the implementation of safety treatments at crossings in this corridor. Other key corridors include the CPKC River Subdivision along the Mississippi River (20 trains per day up to 75 mph) and the CPKC Paynesville Subdivision connecting Detroit Lakes to the Twin Cities (20 trains per day up to 60 mph).
Intermodal Terminals
Minnesota businesses have access to four intermodal rail terminals, where goods are transferred between rail and other modes of transportation. These include the BNSF Midway Yard located in the St. Paul Midway neighborhood, the CPKC Shoreham Yard located in northeast Minneapolis, the Union Pacific Twin Cities Intermodal Terminal and the CN Intermodal Ramp located at the Port of Duluth. The CN facilities were established in 2017 as part of a partnership with Duluth Cargo Connect. The UP facility originally opened as a pop-up ramp facility in 2021 and has seen continued investment by UP for additional turnouts, track and other yard improvements to streamline operations.
Crude by Rail
During the previous State Freight Plan update, one of the key topic areas was mitigation of potential impacts by shipments of crude oil by rail. In the years leading up to that plan, the volume of crude by rail shipments had peaked at their highest levels ever recorded, largely due to the development of oil fields in North Dakota and Canada using hydraulic fracturing processes to obtain what was previously considered to be unproductive areas. Existing pipeline infrastructure was not able to handle this sudden influx of crude oil and rail freight absorbed much of this volume. However, this led to many concerns for public safety due to a string of high- profile crude-by-rail derailments and explosions throughout North America. These events left to deaths and the destruction of property. MnDOT developed a number of strategies to address these concerns, including the installation of additional safety measures along rail corridors with higher volumes of crude-by-rail. However, since the release of the previous plan, the volume of crude oil being shipped by rail has dropped substantially, in large part due to the completion of many regional pipeline projects. While the risks inherent in crude- by-rail shipments have not gone away entirely, it is considered to be much less of an imminent risk.
Highway-Rail Grade Crossing Safety
Over the last 40 years, the U.S. has made significant progress in reducing the total number of crashes at highway-rail grade crossings. There are a total of 6,278 at-grade crossings, with 4,070 being public crossings and 2,208 being private crossings. The number of public crossings has decreased from 6,700 to just over 4,000, which has led to a substantial reduction in the total number of accidents and incidents over the same period. Recently, MnDOT completed a Railroad Crossing Safety Action Plan, which includes evaluating methods for supplementing MnDOT’s risk scoring approach, identifying pedestrian and bicycle safety issues at highway-rail grade crossings and continuing to replace outdated warning devices at these crossings.
Figure 3-8: Crude-By-Rail Volumes
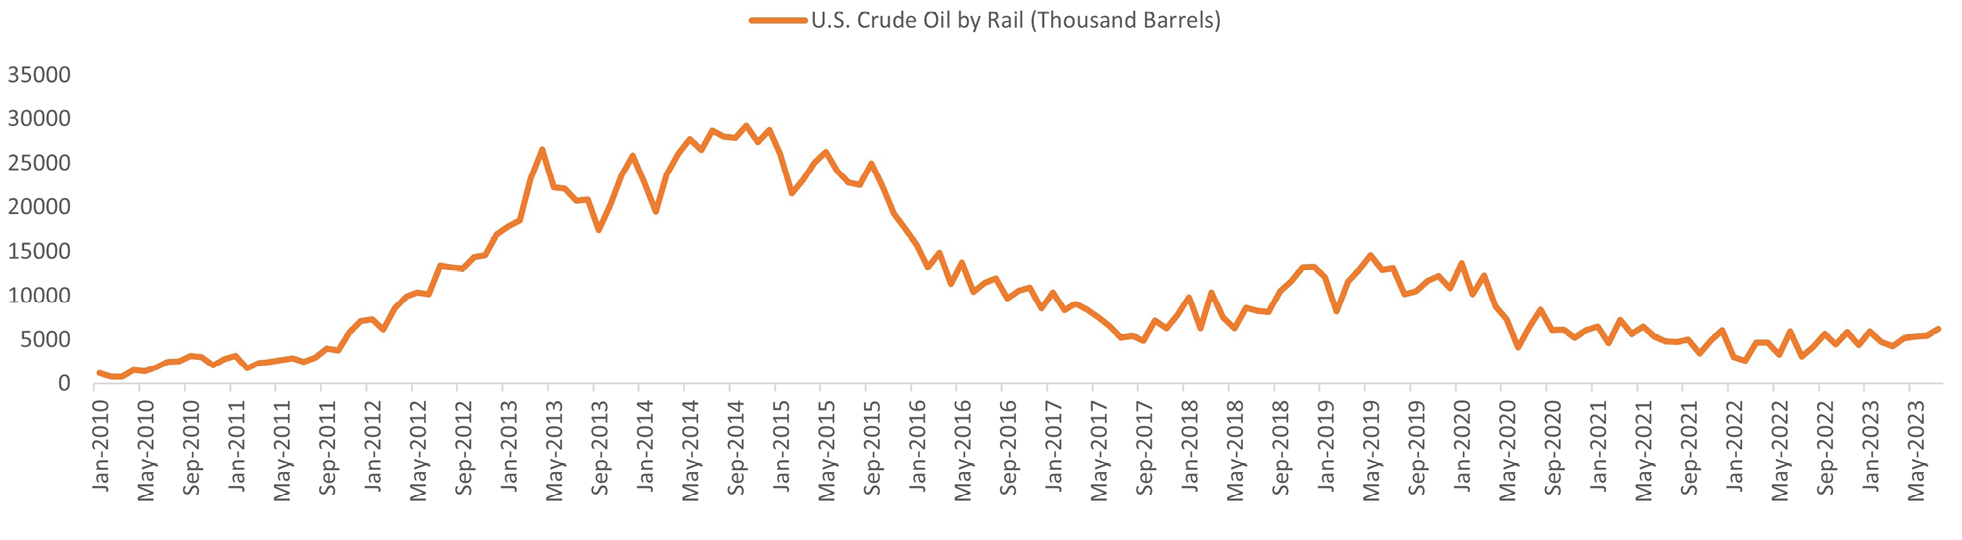
Figure 3-9: Minnesota Freight Railroads
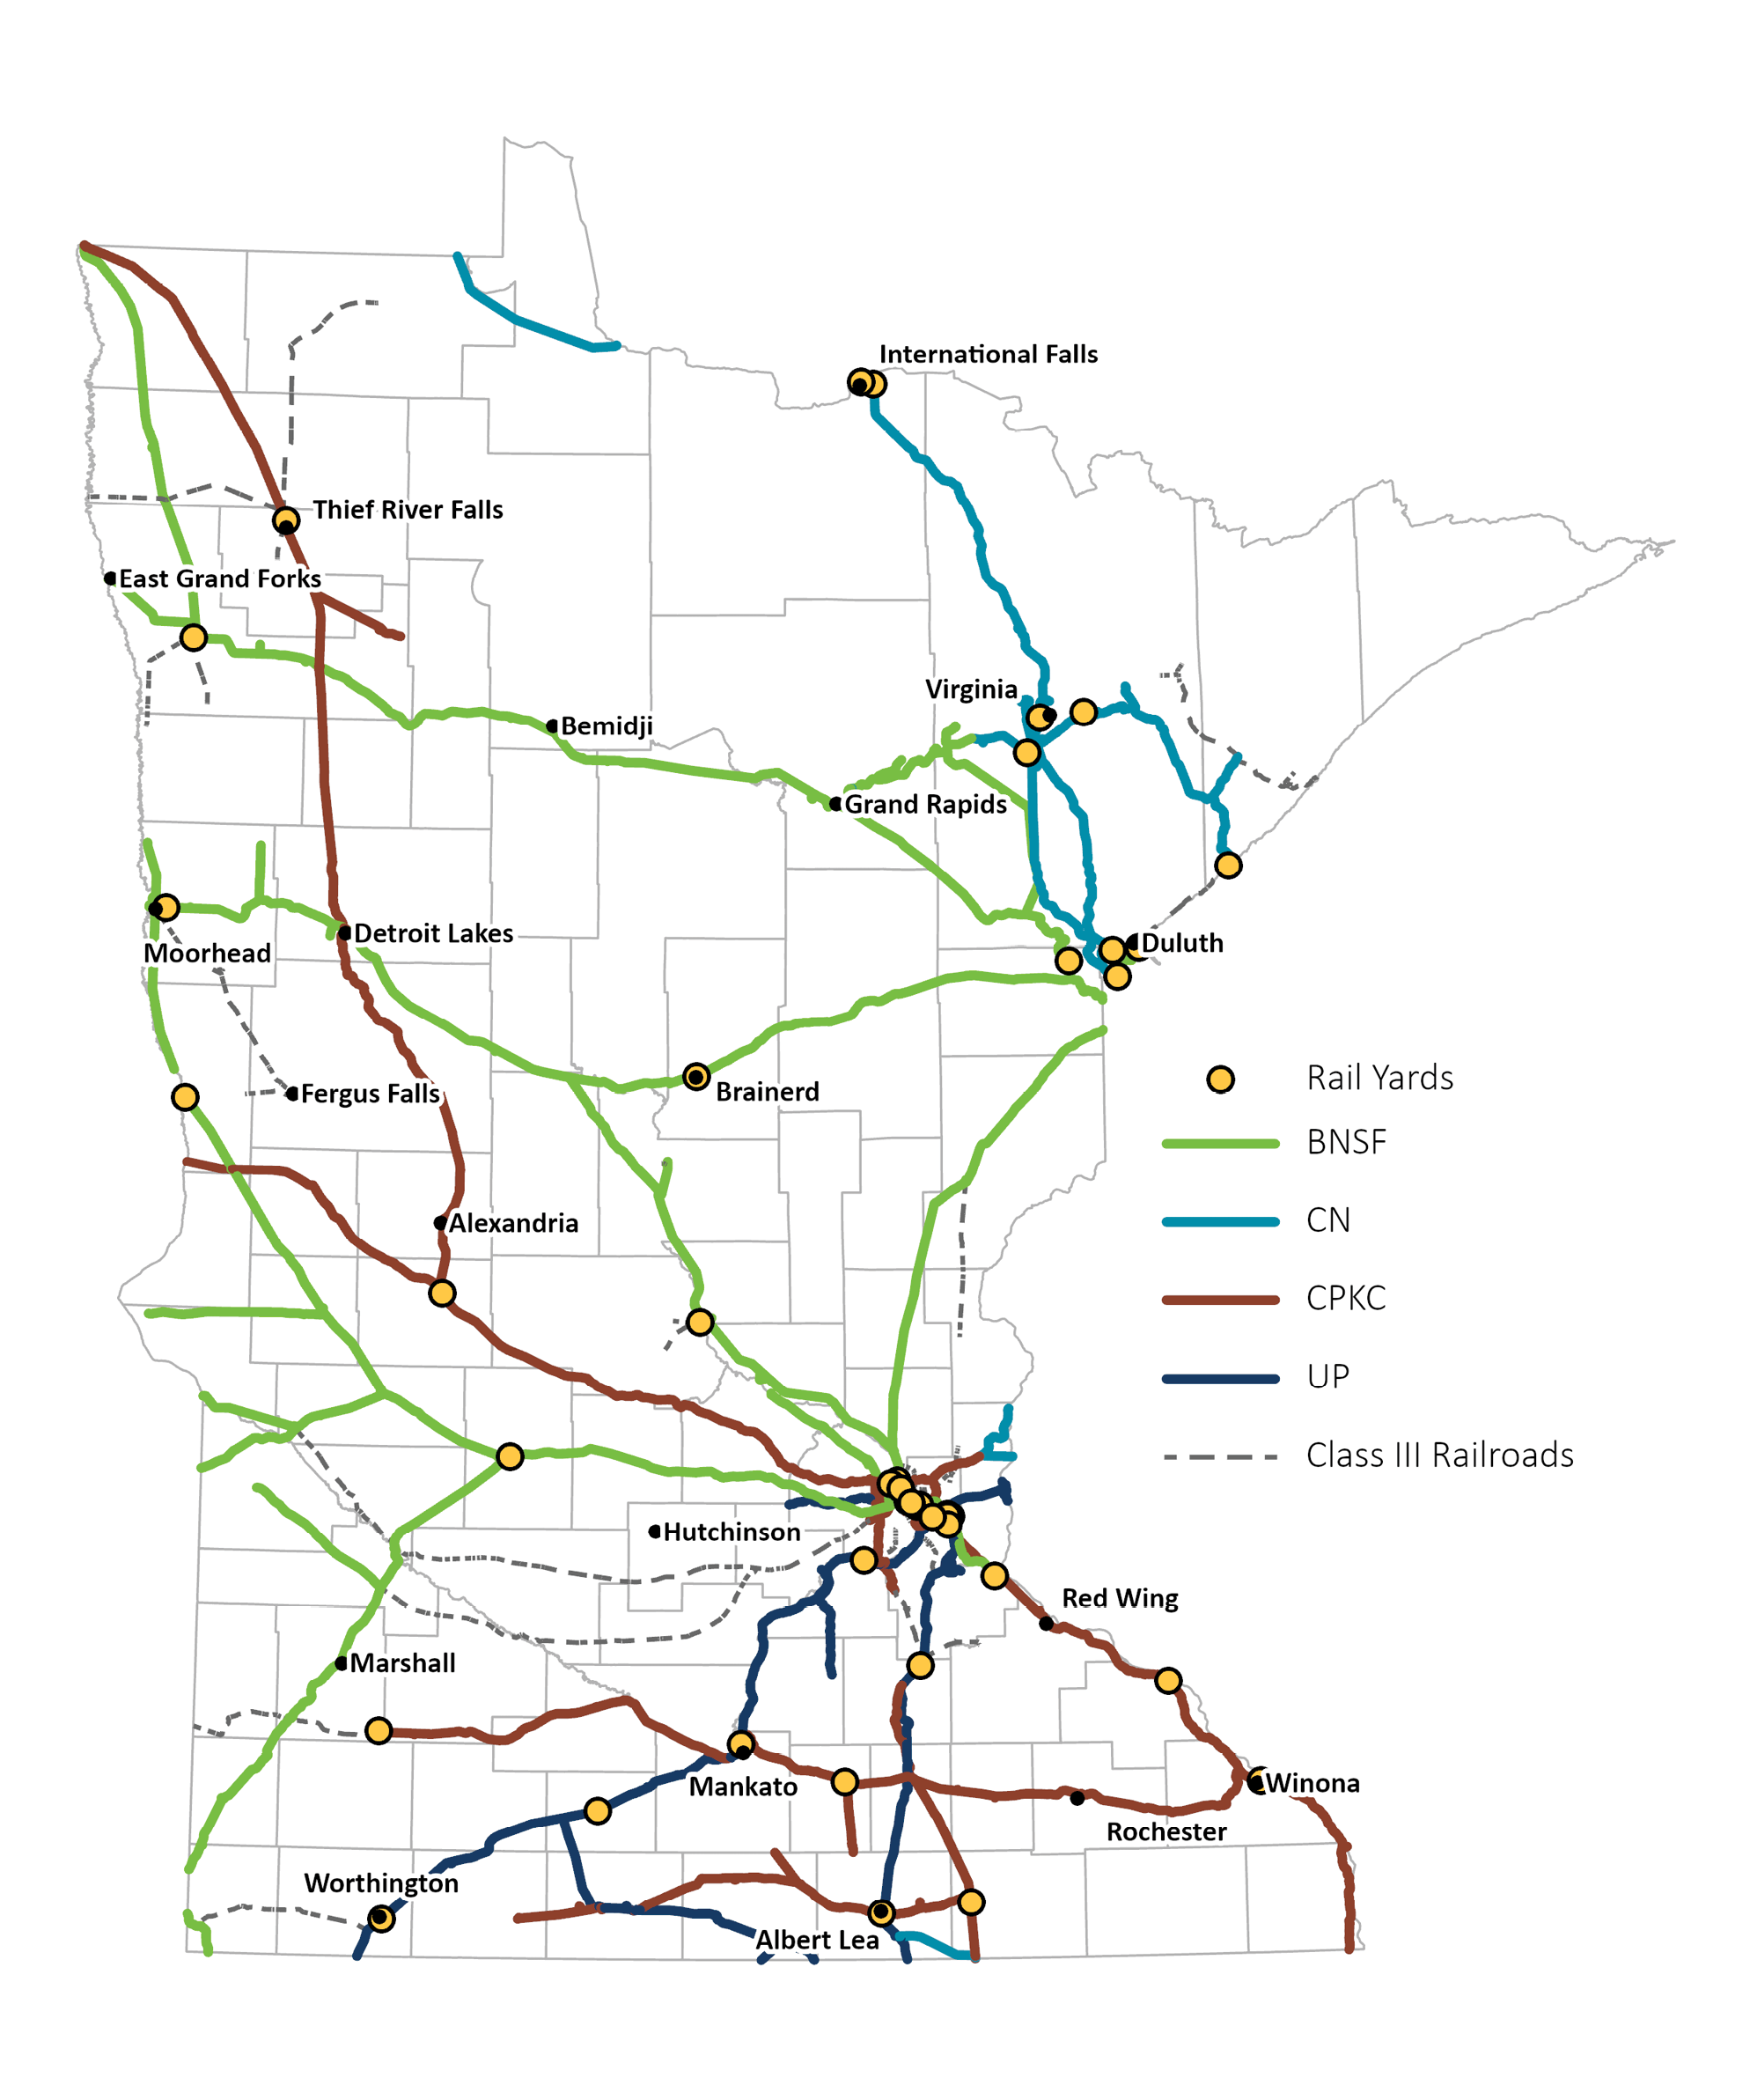
Figure 3-10: Railroad Volumes and Speeds
Waterway
Maritime transportation, particularly the barge and laker ship types most commonly found in Minnesota, is associated with heavy industries like steel and grain and is best suited for moving large volumes of cargo in bulk. This method is suitable for lower-cost commodities that are not time-sensitive. With containerization, cargo can be transferred between ships, trains and trucks without the need for unloading. However, maritime transportation does have high terminal costs and requires significant capital investment for maintenance and operation. Maritime cargo accounts for 2.3% of the freight tonnage moved to, from, or within Minnesota and accounts for 0.2% of freight value. Note the values for tonnage and freight value summarized below are sourced from the FHWA’s Freight Analysis Framework (FAF) dataset and may be undercounting the amount of water freight transported to and from Minnesota.
Waterway Snapshot
- 3 Great Lakes Commercial Ports
- 4 Mississippi River Commercial Ports
- 17 million tons of freight handled annually
Top 3 Commodities by Tonnage:
- Metallic Ores: 5 million tons
- Gravel: 3 million tons
- Cereal Grains: 2.7 million tons
Top 3 Commodities by Value:
- Cereal Grains: $312 million
- Metallic Ores: $310 million
- Other Ag. Products: $164 million
Minnesota benefits from access to two commercially navigable water systems, providing connections to both domestic and international markets. The state has almost 260 miles of navigable waterways, ranking 27th in the nation. The top commodities by value include cereal grain, metallic ore and agricultural products, while the top commodities by weight include food and food products and chemical fertilizers. Three ports on Lake Superior transport over 50 million tons of freight per year and four ports on the Mississippi River System transport an additional 14 million tons of freight per year.
The Duluth-Superior Port is the largest freshwater port in the United States. The port possesses 49 miles of harbor frontage; services three Class I railroads; has NHS intermodal connectors that lead to major intermodal terminals like ports, rail and truck terminals and airports; and there are three surface streets linking I-535 to the Port of Duluth’s Clure Public Terminal. The Clure Public Marine Terminal is home to CN’s Duluth Intermodal Terminal, a joint effort between CN and Duluth Cargo Connect. This intermodal terminal is a land- based hub for containers that provides on-dock rail connections and offers access to CN’s mainlines that connect to crucial markets such as New Orleans, Montreal, Vancouver, Mobile and Halifax.
Table 3-2: Minnesota’s Commercial Waterway Ports
| Great Lakes Ports | River Ports |
|
|
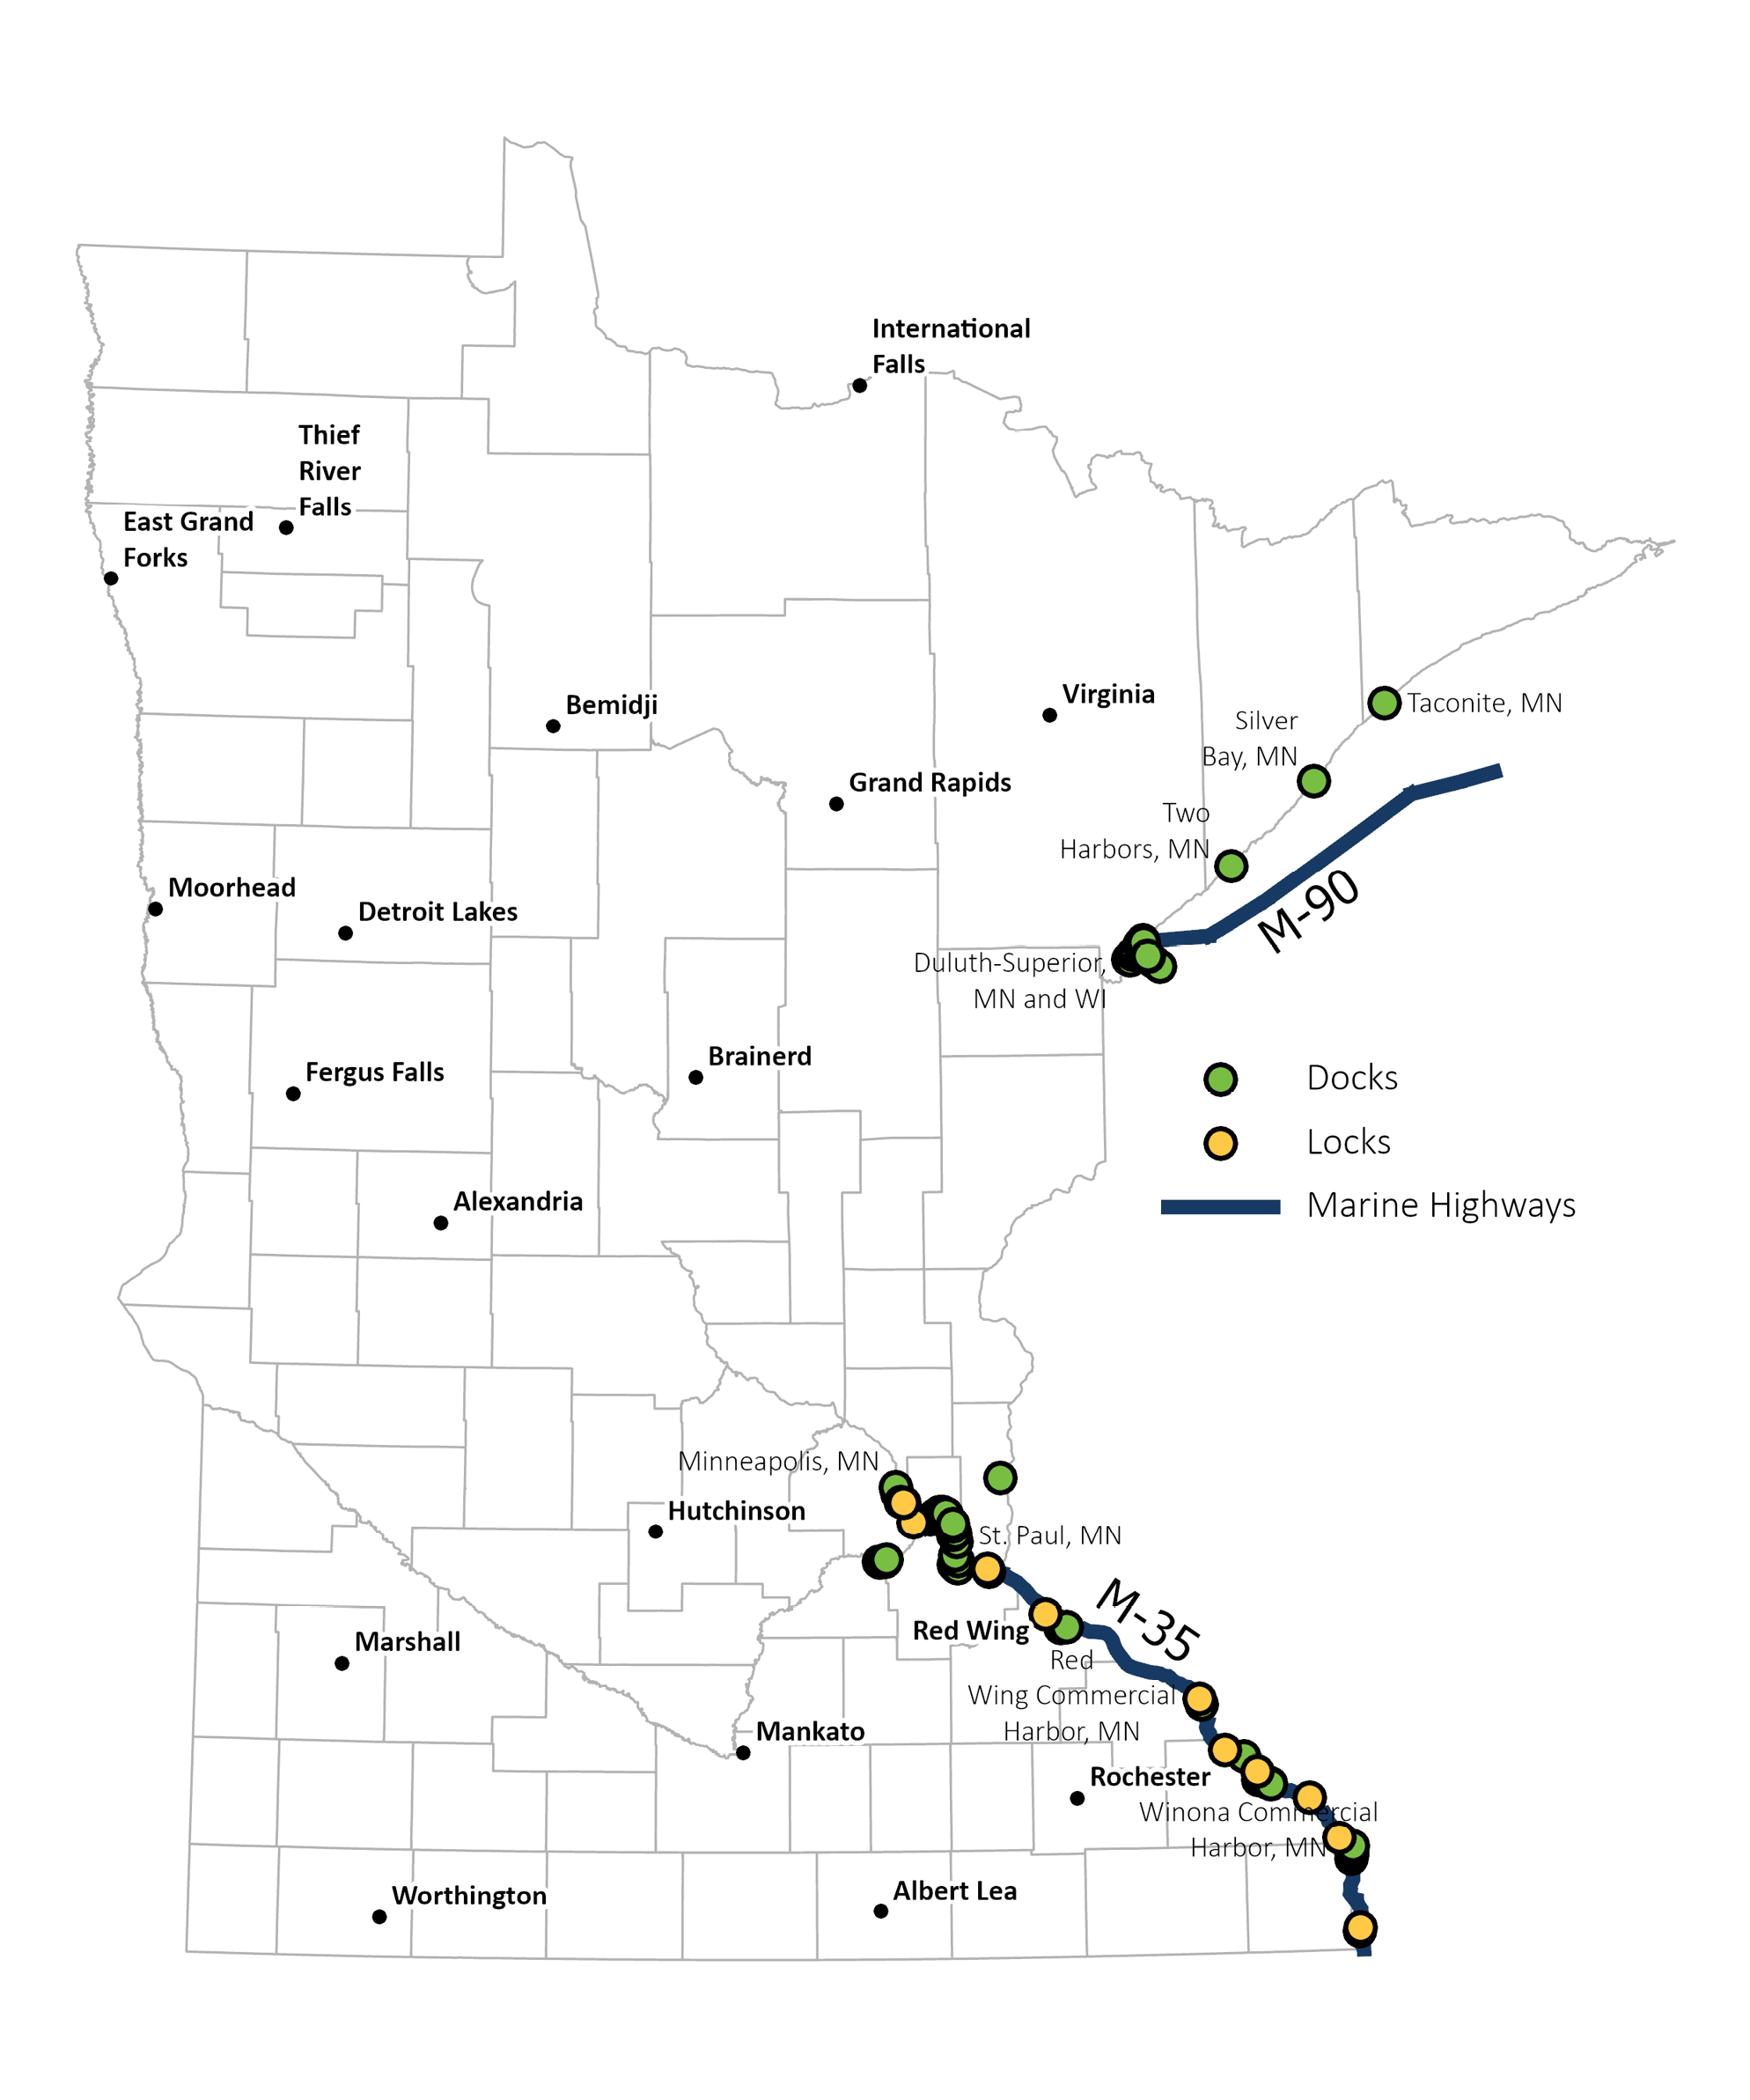
The United States Marine Highway is a network of navigable waterways established in 2007. It aims to reduce congestion on land-side infrastructure, decrease the number of trucks on the road and lessen the carbon footprint from trucking. The segment of the Mississippi River between the Twin Cities Metro area and southeastern Minnesota is designated as M-35 of the Marine Highway System. It extends from Minneapolis to the junction where the Mississippi and Illinois Rivers meet in Grafton, Illinois. This connects the Illinois River to the Mississippi river via Chicago and then leads to The Port of New Orleans, which handled 2.4 million short tons in 2021 and has access to global markets. Finally, along this stretch of the Mississippi in Minnesota, there are three port authorities which include the St. Paul Port Authority, the Redwing Port Authority and Winona Port Authority. The last two ports are part of the Northern Corn Belt Ports, which is part of a larger five-state area. This area is one of the largest grain-producing and exporting regions and is connected by the I-90 crossing of the Upper Mississippi River.
The majority of the operational locks and dams, 80%, on the Mississippi River system were built during the 1930s. Many received major rehabilitation work in the 1980s and 1990s. The most recent operational lock and dam facility, Lower St. Anthony Falls in Minneapolis, was constructed in 1959, while the oldest lock and dam, Lock and Dam 1 in St. Paul, opened in 1917. Dock walls on the system are particularly vulnerable, with some being more than 70 years old, far exceeding the typical 50- year asset life for such structures and are in need of major reconstruction.
To address the issues of aging infrastructure, the US Army Corps of Engineers is exploring the disposition of the three locks and dams located within the city of Minneapolis. In 2021, Barge Terminal Two (BT2) was awarded a $4.14 million grant from the Port Infrastructure Development Program. This funding will be used to enhance and repair a 1,316-foot dock wall that was not up to current standards and has not been updated since the 1960s.
To address the issues of aging infrastructure, the US Army Corps of Engineers is exploring the disposition of the three locks and dams located within the city of Minneapolis. The U.S. Army Corps of Engineers operates and maintains the 9-foot Navigation Channel Project for the Mississippi River, including Upper St. Anthony Falls Lock (USAF), located on the Mississippi River in Minneapolis, Minnesota. Section 2010 of Water Resources Reform and Development Act of 2014 directed the Corps to close the lock to navigation operations, but to continue to carry out emergency operations necessary to mitigate flood damages. Navigation at the lock ceased on June 9, 2015. Prior to the closure of USAF, the lock operated as part of a system to enable navigation to access the upper reaches of the Mississippi River 9-foot navigation channel.
The U.S. Army Corps of Engineers began a USAF disposition study in 2015 and continues to operate USAF for flood damage mitigation. Section 1168 of the Water Resources Development Act of 2018 (WRDA 2018), dated 24 October 2018, directed the Corps in carrying out a disposition study to consider removal of the project or a separable element of the project. Congress directed the Corps, through the WRDA 2020, to convey excess lands adjacent to USAF, to the city of Minneapolis, or its designated entity. Owa’mniyomni Okho’dayapi (OO) is the city’s agent for the land conveyance. The USAF disposition study is expected to be completed in 2025.
With lockage through USAF now closed, the demand for both commercial and recreational lockage decreased at Lower St. Anthony Fall, (LSAF) and Lock & Dam 1 (LD 1). A disposition study of Lower Saint Anthony Falls and Lock and Dam 1 was initiated but is currently paused to expedite USAF.
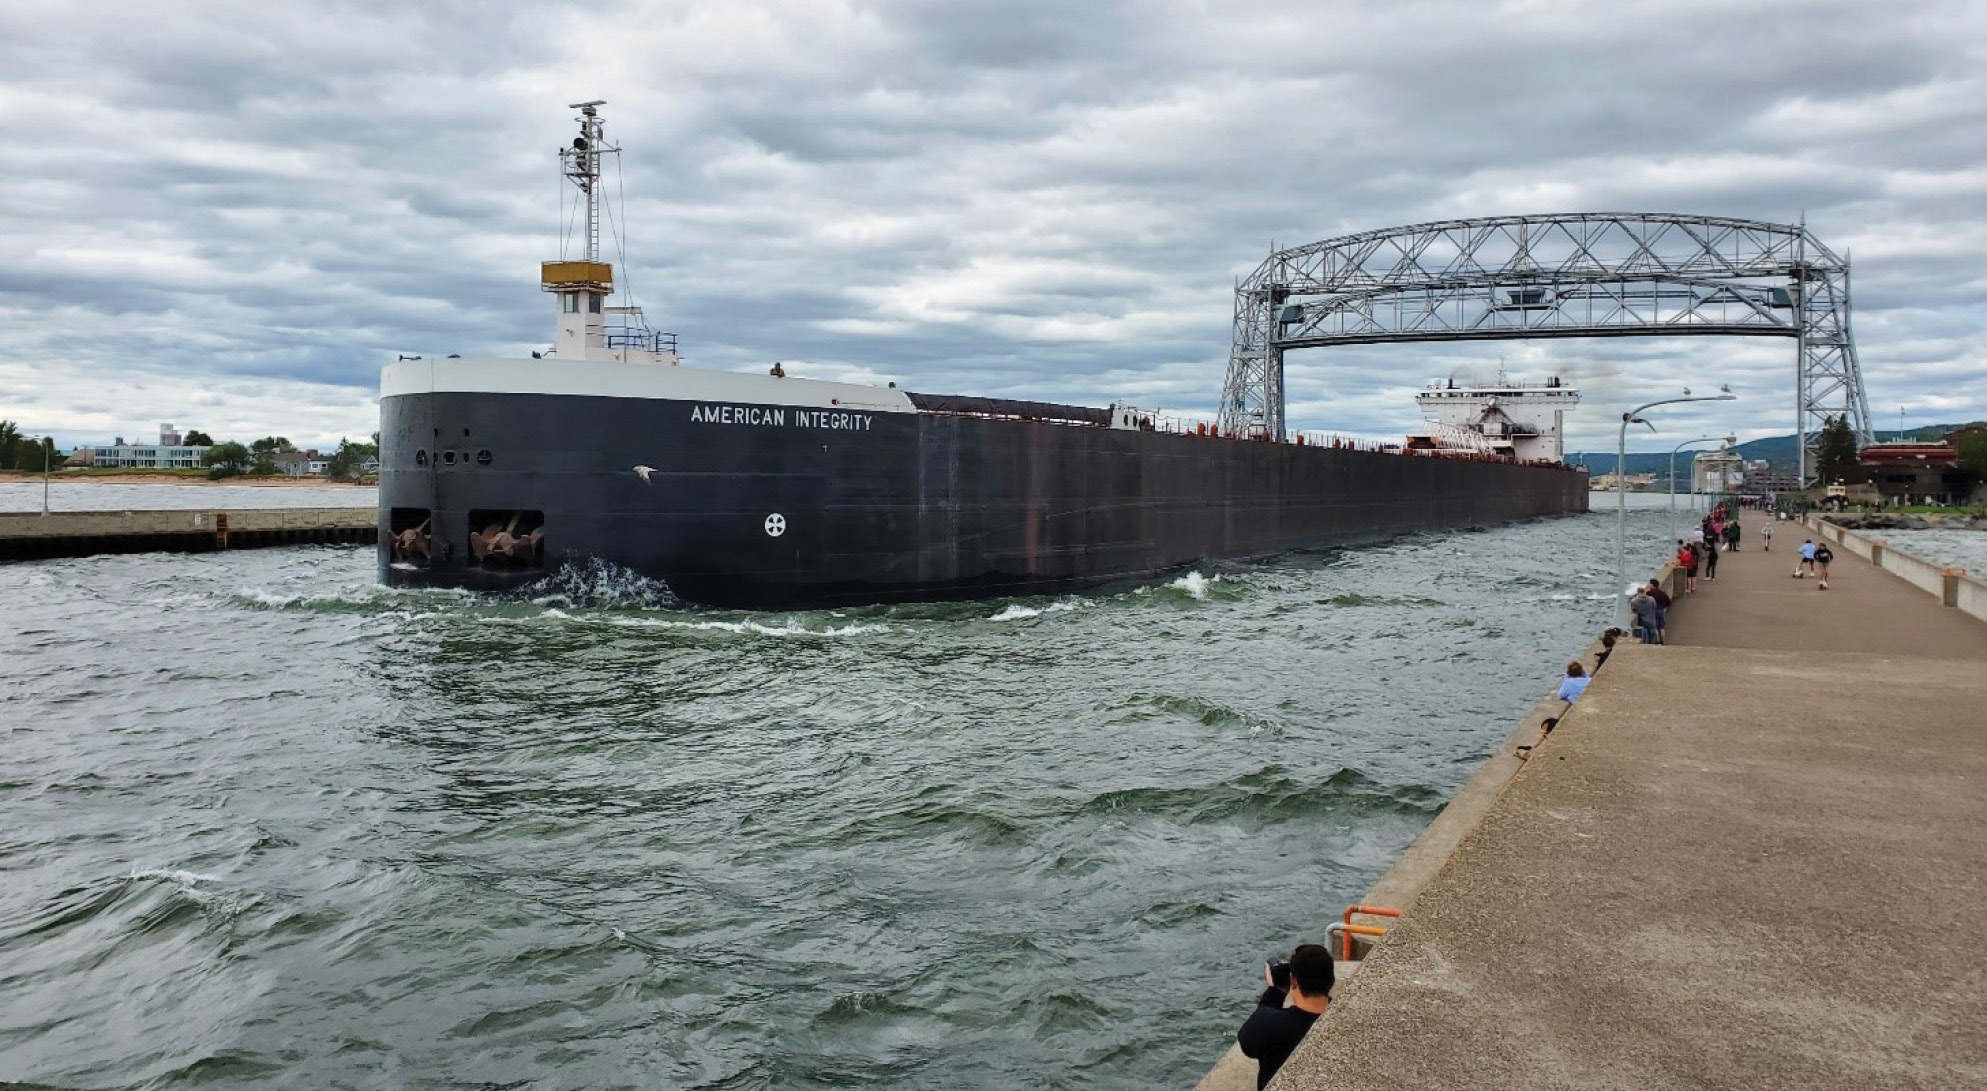
Figure 3-11: Waterway Cargo Facilities
Air
Air cargo transportation has become an increasingly important mode for national and global logistics. It enables the fast movement of high-value, time- sensitive goods over long distances. However, air transportation is expensive and has lower volume capacity compared to other modes of transport that can handle larger cargo volumes. Air cargo accounts for less than one-tenth of one percent of the freight tonnage moved to, from, or within Minnesota but accounts for 4.5% of freight value.
Air Snapshot
- 14 Cargo-Handling Airports
- MSP Accounts for 95% of State Air Cargo
- Primary connecting location for inbound and outbound freight is Memphis, TN (25% of all inbound/freight)
Top 3 Commodities by Tonnage:
- Precision Instruments
- Electronics
- Basic Chemicals
Top 3 Commodities by Value:
- Precision Instruments
- Electronics
- Machinery
Statewide, Minnesota has 133 public use airports. Of these, only 14 have provided any amount of cargo handling between 2019 and 2023 through the movement of freight or mail parcels. Air cargo handling is dominated by the Minneapolis-St. Paul International Airport (MSP) which handled approximately 95% of all Minnesota Air Cargo. The most heavily used connecting airports for air cargo are Memphis, TN, Louisville, KY and Indianapolis, IN. Memphis is the site of FedEx’s “Global Superhub,” while Indianapolis is used as a FedEx regional hub. Louisville is the site of UPS’s primary hub. Currently, the air cargo facilities at MSP cover around 523,000 square feet and four areas are designated for handling and processing freight. Amazon has doubled its volume and in response to the increasing cargo volume, MSP is planning to expand its capacity. A 2021 air cargo study completed by MSP found that Amazon was the fastest growing air cargo operator at MSP. All other cargo operators at the airport are projected to have adequate facilities to handle operations through 2040.
Rochester International (RST) follows with over 4% of the total tonnage. The Mayo Clinic receives most of the cargo deliveries, accounting for one-third of all cargo from this airport. This includes tissue samples, which are packaged together, resulting in a higher total volume but lower weight. The majority of the cargo is transported from FedEx Express’s air cargo hub in Memphis, while medical devices are flown to Rochester from Minneapolis-St. Paul and Fort Wayne.
Figure 3-12: Average Air Cargo Annual Tonnage (2019-2023)
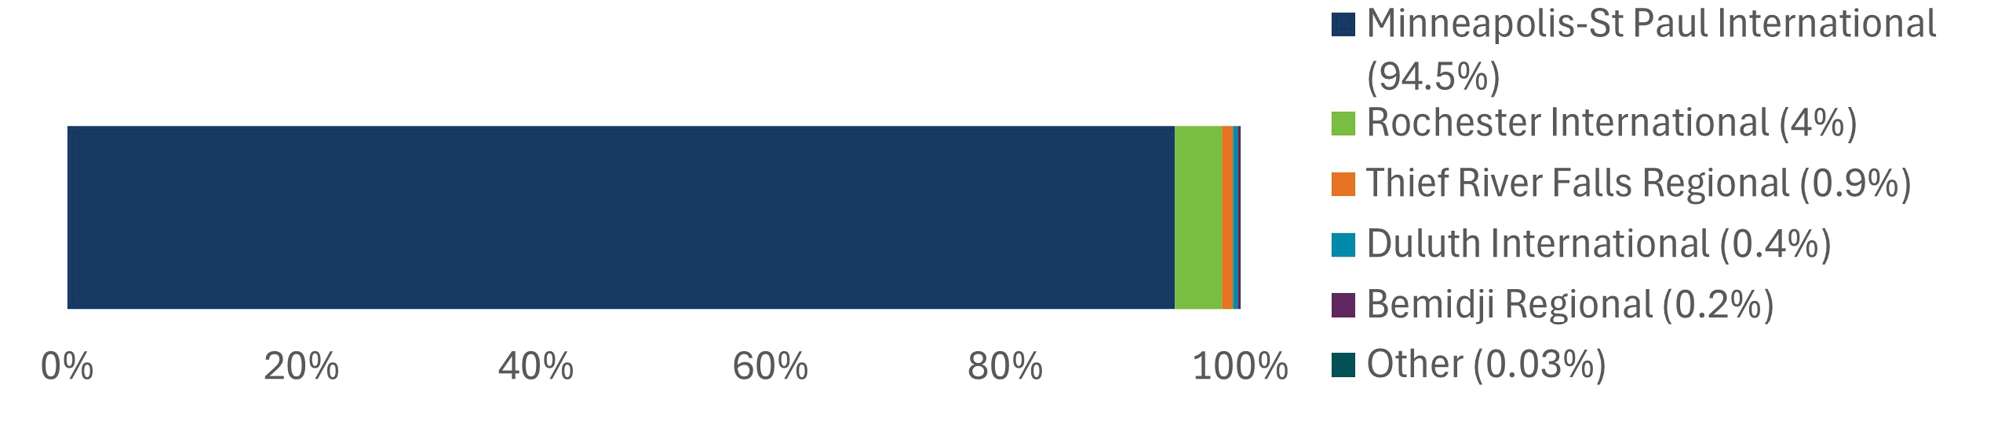
Figure 3-13: Cargo Airports
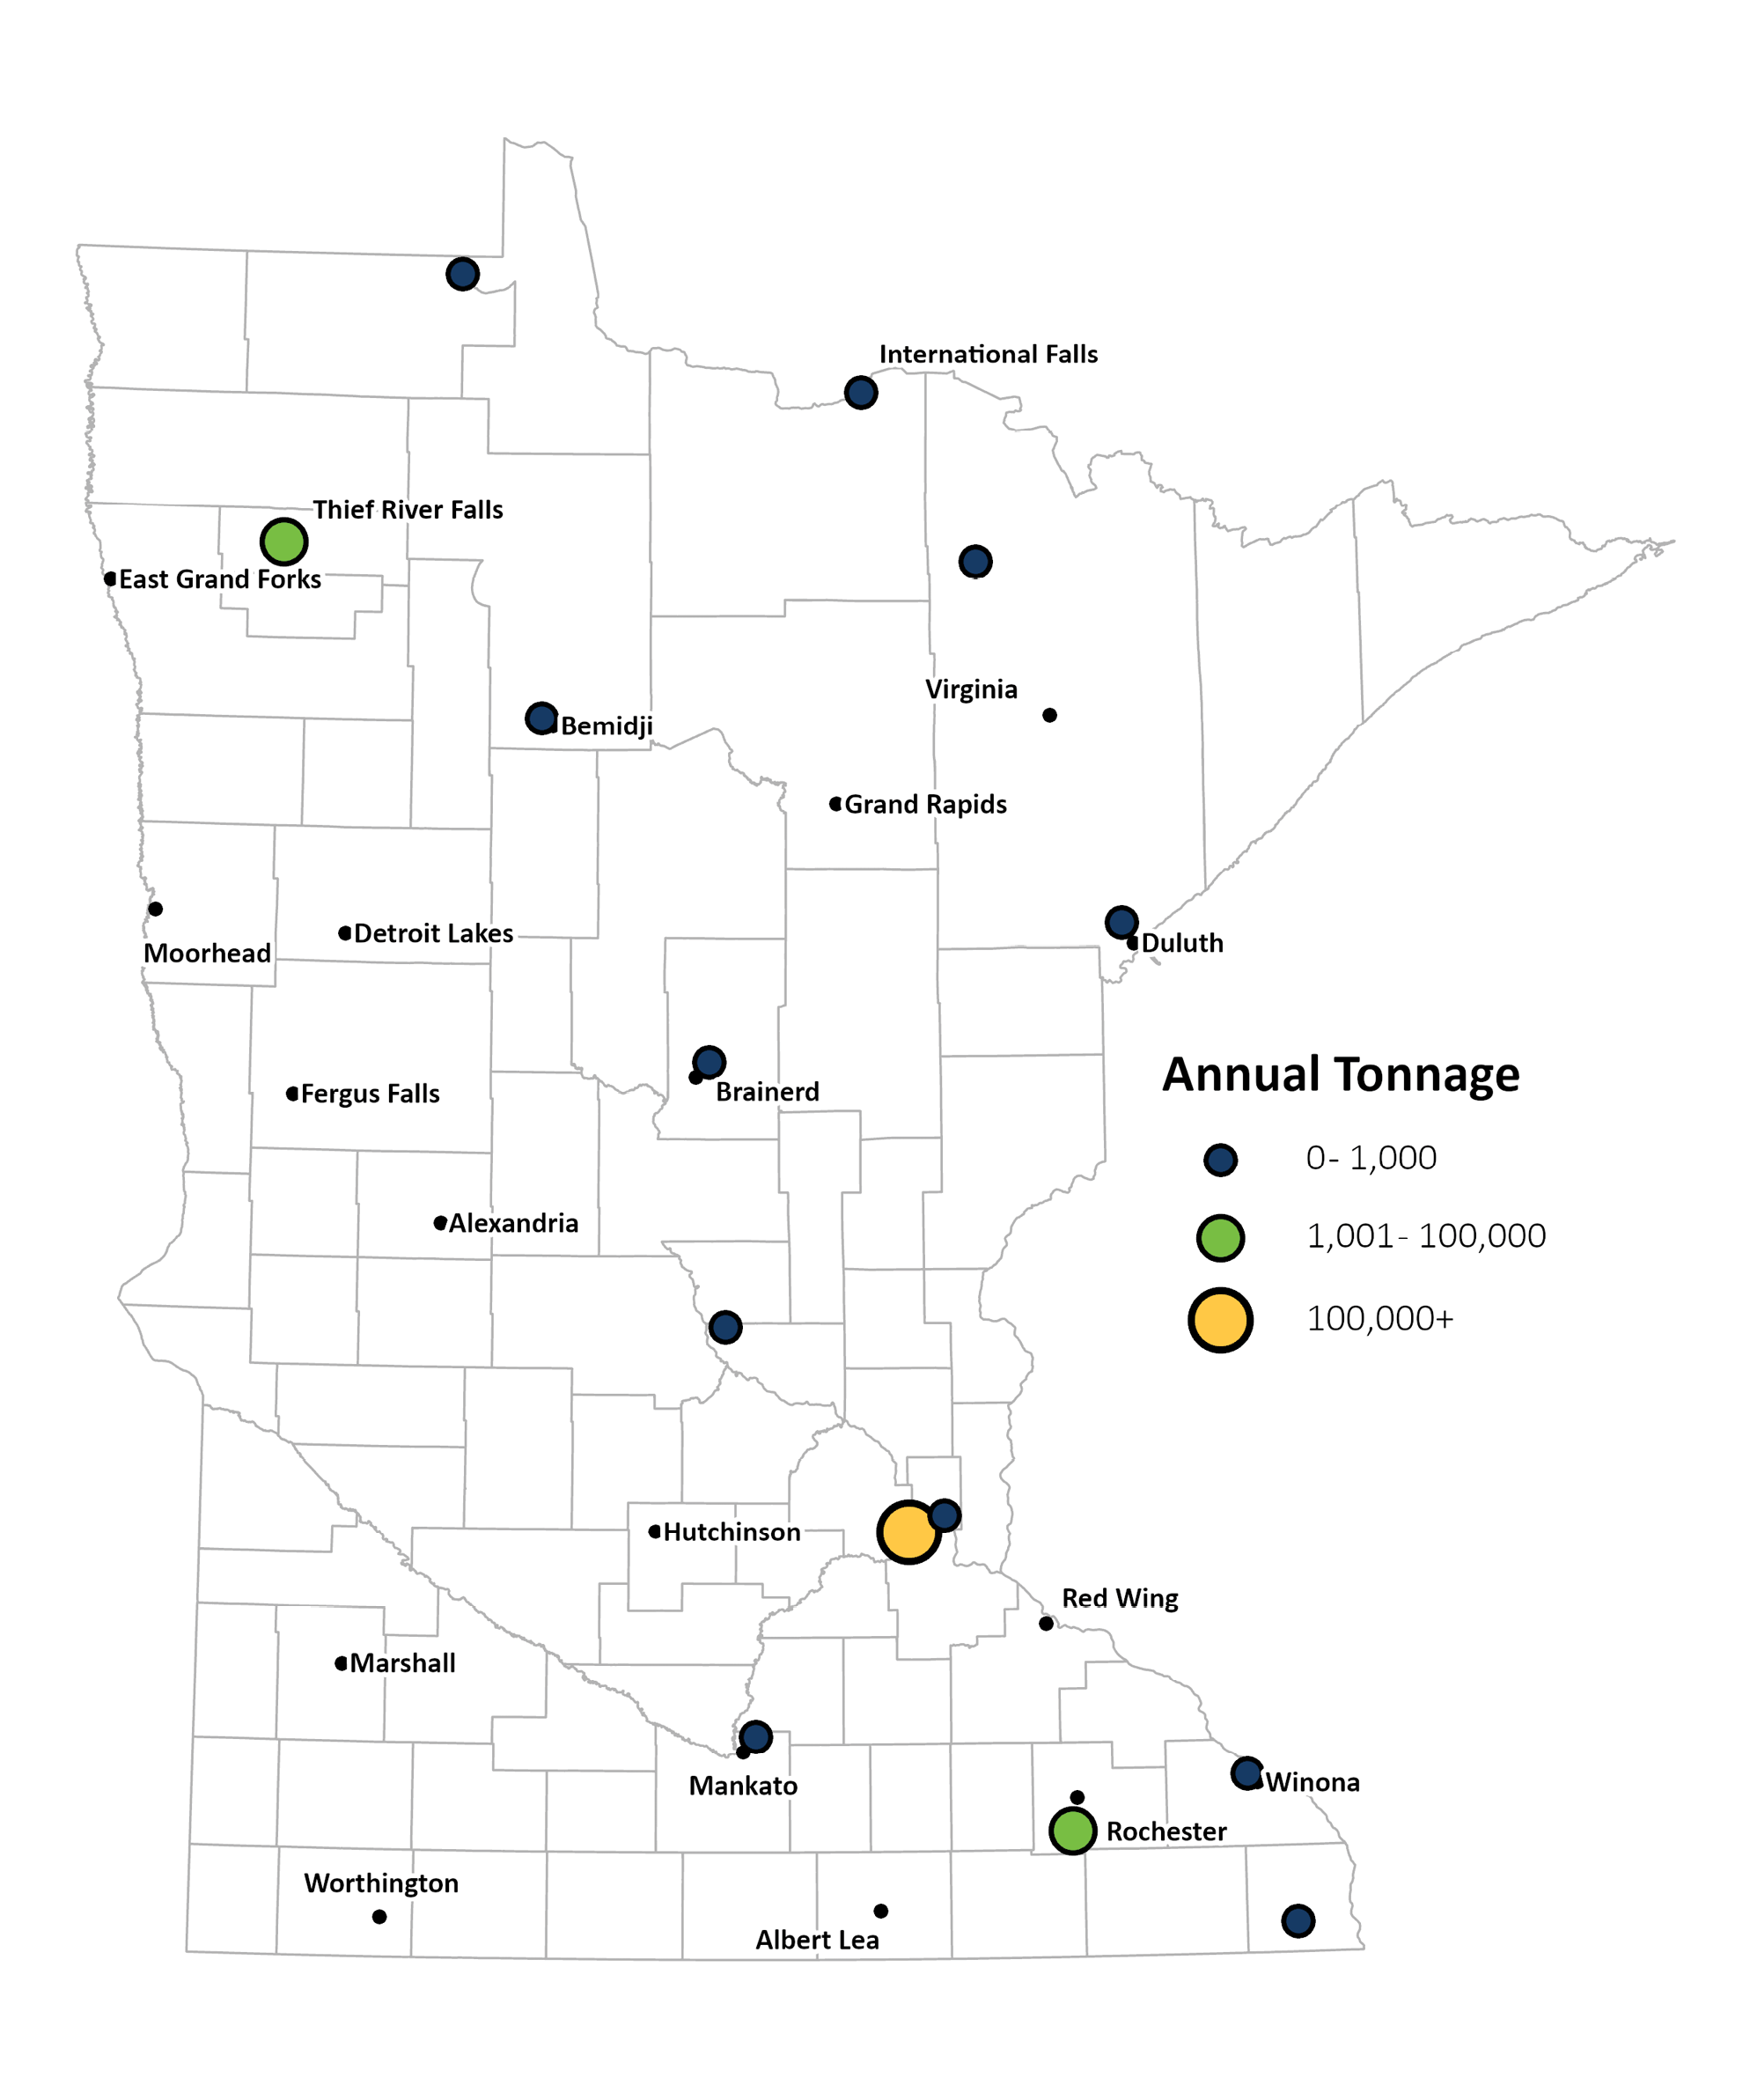
The Bemidji, Duluth and Thief River Falls regions have airports that handle a significant amount of air cargo. These airports are essential for providing air cargo services to smaller markets in District 1 and 2, allowing businesses to access national and international markets for shipping goods and obtaining materials and finished products. Thief River Falls Regional (TVF) is particularly notable, handling over 1% of the total tonnage. DigiKey Electronics, a major distributor of electronic components, is the fourth-largest supplier in the United States with an annual revenue in excess of $5 billion. Recently, DigiKey Electronics proposed constructing a larger air cargo hangar at the Thief River Falls Regional Airport. This expansion would increase the airport’s capacity, enabling it to handle higher volumes and improve the supply chain.
Pipeline
Pipeline transportation is a cost-effective method for moving liquids and gases to specific locations for consumption and over long distances. Pipeline terminals are crucial as they connect to refineries and harbors. While pipelines are generally safer than transporting liquids by rail, their installation and operation are not without controversy and there are several environmental and social issues associated with them. These include potential for spills and leaks, which can contaminate water supplies and ecosystems, as well as intersecting with Tribal lands.
Pipeline Snapshot
- 20,000+ milesof pipelines
- 12th and 62nd largest refineries in the country
- 440,000 barrels of crude oil processed daily
- Natural gas and other fossil products: 99 million tons, $19 billion
- Crude petroleum: 36 million tons, $10 billion
- Gasoline: 2 million tons, 0.9 billion
Minnesota relies on imports for all petroleum and natural gas as it does not have its own fossil fuel resources. Pipelines transport 19% of total freight tonnage and 17% of total freight value into, out of and within the state. Precise pipeline mileage is difficult to measure. However, it is estimated that there are more than 20,000 miles of interstate pipeline in Minnesota, plus many more miles of smaller distribution pipelines. Approximately 30% of crude oil in the United States flows through Minnesota via pipelines, moving between refineries near St. Paul, Mandan, ND and Superior, WI. The state’s proximity to the Bakken oil fields in North Dakota and Saskatchewan results in a significant amount of crude oil flowing through to refineries. The two refineries in Minnesota are located in St. Paul and St. Paul Park. The Pine Bend facility produces 335,000 barrels per day, ranking 12th in the nation. The refined crude oil is transported via a dedicated pipeline to the Minneapolis-St. Paul International Airport for aircraft fuel and to the Wisconsin Pipeline for further distribution.
Figure 3-14: Pipelines, Pipeline Terminals and Refineries
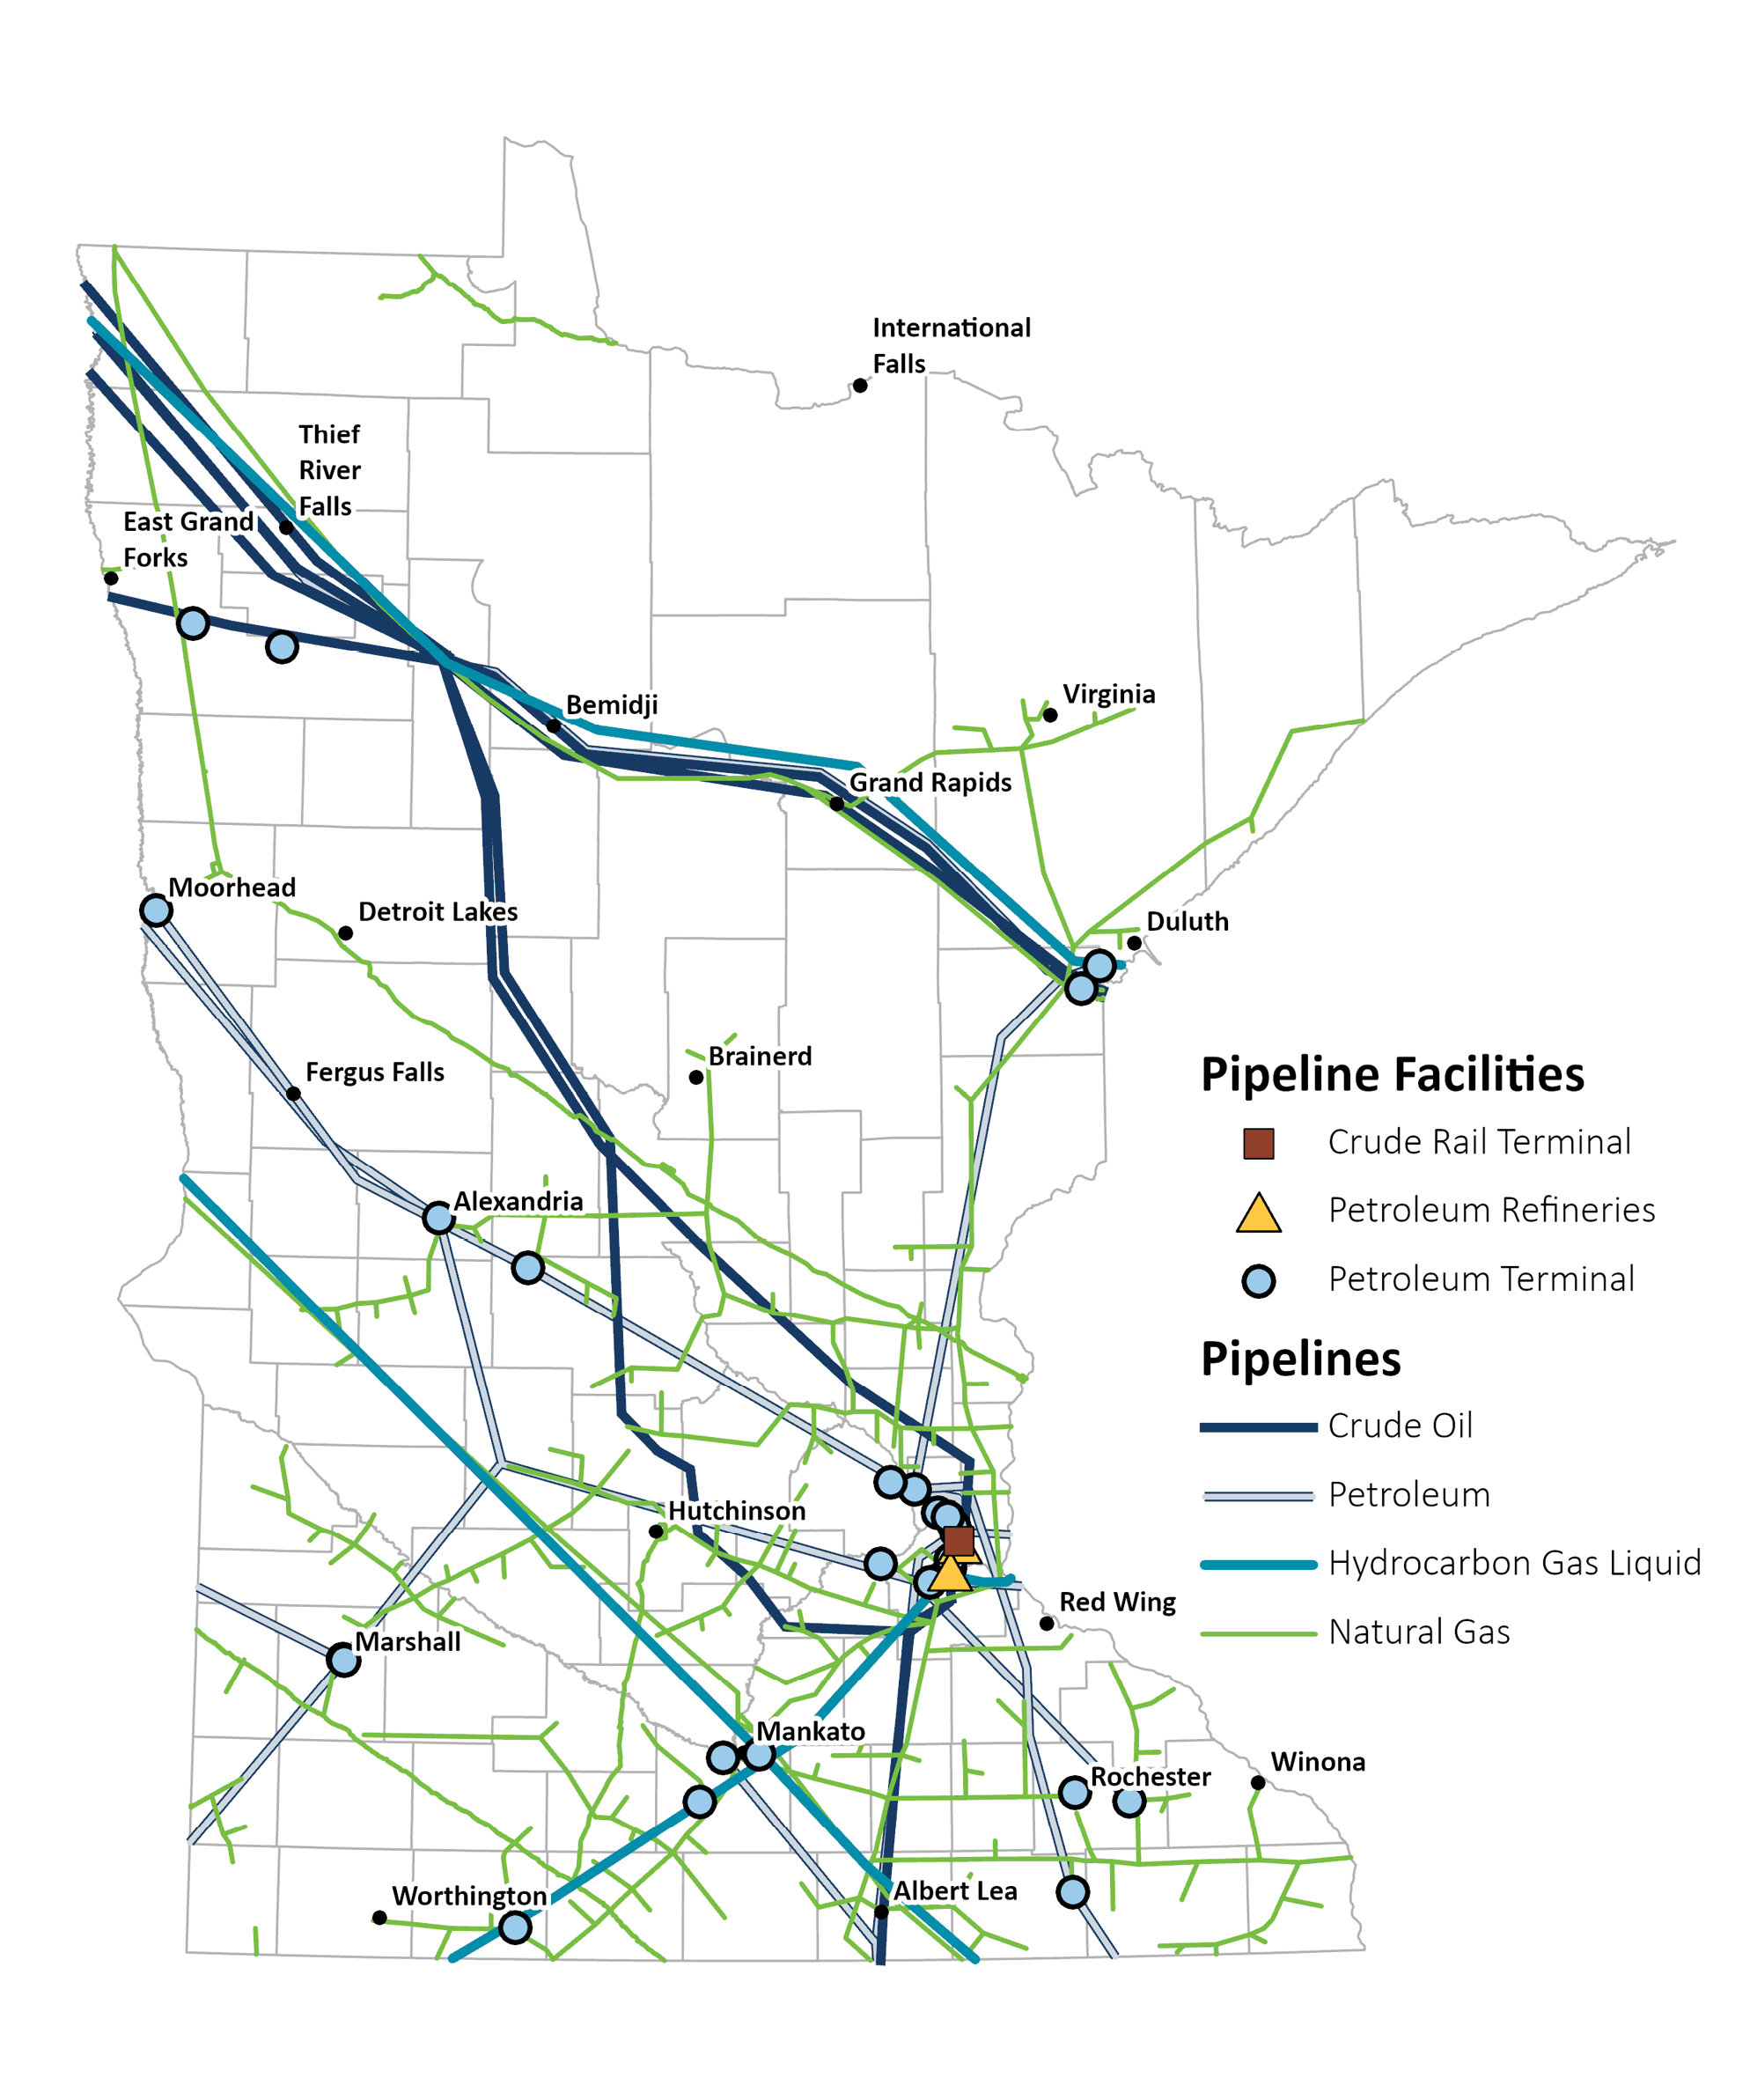
The St. Paul Park refinery produces 105,000 barrels per year and is ranked 62nd in the US. Both refineries have petroleum product terminals from which products are transferred by truck or rail.
The Enbridge Line 3 carries 760,000 barrels of crude oil per day, connecting the Canadian oil sands to oil depots in Superior, Wisconsin. The construction of the new Enbridge Line 3 pipeline began in 2021 and was completed in 2023. The new pipeline follows the same path as the previous one from North Dakota to the Clearbrook Terminal in Clearwater County, Minnesota. However, from the Clearbrook Terminal to Superior, Wisconsin, the pipeline was built in a new right-of-way, south of the existing Line 3 and ends at an existing terminal in Superior, Wisconsin.
Natural gas is transported from various production areas such as Western Canada, North Dakota, Wyoming, Montana, Kansas, Oklahoma, Texas and New Mexico. Minnesota consumes 450 billion cubic feet of natural gas annually, with two out of every three homes in the state using natural gas for heating. The state’s ethanol industry also relies on natural gas for power. Industries in Minnesota that use significant quantities of natural gas include food manufacturing, petroleum refineries, iron and steel mills and fabricated metals production.
Minnesota is home to the 12th largest oil refinery in the country in terms of barrels produced per day. Between the Flint Hill Resources Pine Bend Refiner and the Marathon St. Paul Park Refinery, Minnesota produces 440,000 barrels of crude oil per day, approximately 2.4% of national oil production.
Military Freight
Two federally designated freight networks were created with the express purpose of providing defense access, continuity and movement capabilities during times of emergency. These include the Strategic Highway Network (STRAHNET) and the Strategic Rail Corridor Network (STRACNET). The locations of these networks and the location of the Camp Ripley National Guard facility are shown in Figure 3-15.
- Minnesota Joint Forces Headquarters, St. Paul
- 34th Infantry Division and subordinate units, Arden Hills
- 133rd Airlift Wing, St. Paul
- 148th Fighter Wing, Duluth
Other units include:
- 88th Readiness Division (US Army Reserve), Fort Snelling
- 934th Airlift Wing (US Air Force Reserve), Minneapolis
One Army installation, Camp Ripley, is located in Minnesota. This training and readiness center, managed by the Minnesota National Guard, is located just north of Little Falls and provides support and services for training all branches of the U.S. Armed Forces. There are no active duty military units in Minnesota. Although the state includes 19,000 military personnel, approximately 97% are members of Reserve Forces. Regardless, logistics support is necessary to support training and maintain operational readiness. Frequent transportation movement of supplies, to include ammunition, fuel, food, equipment, maintenance items and numerous other needs requires a resilient supply chain network to support military units in Minnesota.
The conditions and performance of the freight system designated to support military operations in Minnesota is analogous to the status of Minnesota’s multimodal freight system. There are no current issues that impedes military units and installations in Minnesota from performing their assigned roles and missions. The designated system of roadways, rail lines and aviation infrastructure to support military transportation needs are efficient, reliable and safe.
Figure 3-15: Military Freight Facilities