Current and Future Freight Trends and Issues
The dynamic nature of freight mobility and trends affecting freight movement must be considered when developing policies, programs and projects to address freight needs and issues. While trucks currently dominate the tonnage and values of freight movement in Minnesota, the increased congestion on urban and rural roadways highlights the need to plan for multi-modal and intermodal movement.
Overview
The state’s freight system is influenced directly and indirectly by overarching global, national and state trends. These include changes in the composition of the state’s population, workforce, economy, technologies, consumer preferences and climate. The system is also significantly influenced by macro trends in national and global economies, local and global health trends, materials availability, the international trade environment and supply chain performance. By monitoring and analyzing the progression of these and other factors, Minnesota’s planners and policymakers can anticipate future impacts and plan for safer, more efficient and more sustainable freight movements.
Global Trade and Supply Chain Disruptions
Many aspects of Minnesota’s economy are directly or indirectly linked to global markets and supply chains. Goods exported accounted for 5.3% of Minnesota’s GDP, Minnesota’s exports of manufactured products support an estimated 81,000 jobs, 8,121 companies exported goods from Minnesota and 86% of those companies were small and medium enterprises with less than 500 employees. (Source. Office of the United States Trade Representative.) Even small changes to markets, supply chains, or trade policies can have large effects on Minnesota’s industries, freight system performance, availability of goods and economic competitiveness. This section describes some of the key trends and issues that have previously impacted Minnesota. The broad range of goods exported from Minnesota that could be impacted by disruptions are shown in Figure 2-1. This section will explore some of the primary global issues affecting Minnesota.
COVID-19
The full impact of the COVID-19 pandemic on Minnesota’s economy, especially freight movements and supply chain challenges, will likely continue to linger for years. Beside the initial shock from the pandemic, which limited consumer demand, spending restrictions in travel, entertaining and other services in combination with an influx of cash from stimulus payments shifted consumer preferences away from services to a variety of durable goods and increased e-commerce.
The COVID-19 pandemic laid bare the vulnerabilities to multiple aspects of the integrated supply chains. Global supply chains and logistics sectors are fragile systems consisting of numerous links and were unprepared for unprecedented shifts in consumer demand, the accelerated rise of e-commerce and the challenges in workforce trade policies can have large effects on Minnesota’s industries, freight system performance, availability of goods and economic competitiveness. This section describes some of the key trends and issues that have previously impacted Minnesota. The broad range of goods exported from Minnesota that could be impacted by disruptions are shown in Figure 2-1. This section will explore some of the primary global issues affecting Minnesota. Manufacturers and shippers have been forced to place more emphasis on supply chain resiliency including diversified supply sources, larger inventories and flexible scheduling.
With the onset of lockdowns, quarantines and other public health safety measures intended to slow and reduce the impacts of COVID-19, public mobility was severely impacted. This led to a drastic fall in truck and passenger vehicles crashes that coincided with the January to March of 2020 drop in truck vehicle miles traveled (VMT) of 9%. However, compared to overall highway VMT, truck tonnage levels rebounded much more quickly and recovered to 2019 levels of tonnage in 2022. The overall trend since 2021 has seen an increase in both highway VMT and truck tonnage.
United States-Mexico-Canada Agreement (USMCA)
In March 2020, the United States-Mexico-Canada Agreement (USMCA) was ratified. With Canada being the greatest export partner of the United States and Mexico surpassing China as the greatest import partner, this long-term agreement has significant potential to strengthen north-south trade ties and increase truck volumes at the border crossings between Minnesota, Manitoba and Ontario. It is also not clear what the long-term impact of the U.S.-China tariffs and increasingly competitive relationship will have on Minnesota’s trade and freight practices, but it is possible that the USMCA will be able to assist in easing some of the impacts created by tariffs and trade-wars more globally.
Figure 2-1: Value of Minnesota Exports by Trading Partner
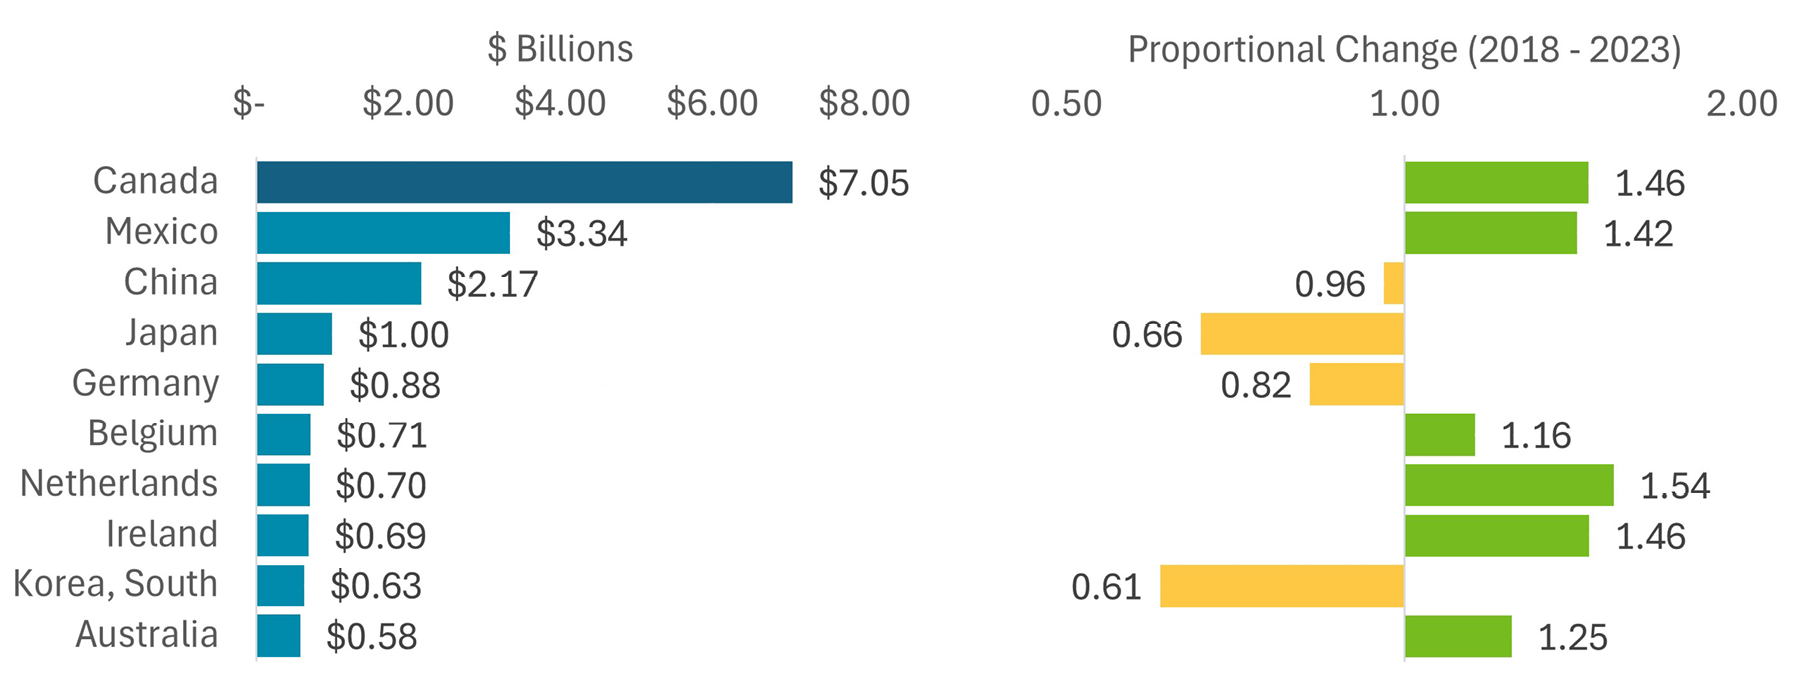
Figure 2-2: Value of Minnesota Imports by Trading Partner

On/Near Shoring
Recent geopolitical tensions and disrupted supply chains during COVID-19 brought to light the challenges related to a single sourcing for international trade. Companies are reconsidering their operating strategies to diversify sourcing by exploring alternative locations to safeguard supply chains. Additionally, as countries like China’s cost advantage declines with salaries and cost of living increasing, companies are looking to other low-cost alternatives closer to their main market.
- Near-Shoring: Refers to the relocation of foreign manufacturing or business operations to a new country that is closer to the domestic headquarters while still retaining benefits such as lower labor and materials costs.
- On-Shoring (or Reshoring): Refers to the relocation of foreign manufacturing or business operations to the company’s original country. This may be pursued if the reduced transportation costs and increased reliability of shipments outweigh the potential increase in manufacturing costs.
While these trends have been broadly discussed for years, recent studies and surveys have indicated that, in practice, few businesses in Minnesota have been pursuing these strategies in a meaningful capacity. A study by the Minnesota Chamber of Commerce found that more than half of business survey respondents indicated a desire to increase the resiliency of their supply chains by adding backup suppliers, but fewer than 10% indicated the use of near-shoring or on-shoring as a strategy. A frequently cited issue is the higher cost of local suppliers.
Labor Disputes
Despite the continued and steady decrease in the number of U.S. employees that are represented by a union, the labor movement in the U.S. has seen a resurgence in the past few years. In particular, the use of work stoppages has been used by many employees as a negotiating tactic. Both the number of work stoppages and the number of employees involved in the stoppages has increased between 2020 and 2022. While these numbers are less than the peak work stoppage activity in 2018 and 2019, this data does not include work stoppages involving fewer than 1,000 workers. Notably, many of these strikes—or threats of strike—have been in industries directly tied to the supply chain or freight systems such as dock workers and railroads employees. Two of the most prominent and relevant freight-related labor disputes are the 2023 port labor dispute which impacted the primary ocean gateway for US goods, as it affected operations of both the Port of Los Angeles and the Port of Long Beach and the 2022 railroad labor dispute.
Port and Shipping Lane Disruptions
Over 2021 and 2022, the Port of Los Angeles and the Port of Long Beach were subject to record backups and backlogs. The Port of Long Beach reported it handled 807,700 total 20-foot-equivalent units (TEUs) in August 2021, up 11.3% year-over-year (YoY) and up 21.6% from August 2019. The Port of Los Angeles processed 954,380 TEUs in August 2021. At the time of this writing, port operations have largely normalized, primarily due to a range in operational shifts at the ports including expanding hours to “24/7” operations, improved scheduling processes and an overall stabilization of global supply chains.
War In Ukraine
The ongoing war, which increased in intensity with the full-scale Russian invasion of Ukraine, has had multiple global impacts for supply chains. The disruption of agricultural production and the ensuing uncertainty of wheat shipments from Russia and Ukraine, who combined account for nearly 30% of global wheat exports, has had a noticeable impact on global wheat supply chains, even in Minnesota. While the conflict has led to an increase in the price of wheat, Minnesota wheat farmers are also facing higher costs for key agricultural inputs such as fertilizer and fuel. Uncertainty and volatility of the global wheat market is likely to continue for the foreseeable future.
Shipping Lane Disruptions
The Suez Canal facilitates approximately 12% of global trade. In March 2021, one of the largest container vessels ever built became stuck in the Suez Canal, blocking the waterway for six days, causing a backlog in marine traffic at both ends of the canal. Attacks on vessels in the Red Sea in 2023 and 2024 have also disrupted trade and caused some container lines to travel a much longer route via the Cape of Good Hope, adding 10 days or more to shipping schedule and cost. The Panama Canal which supports 5% of world trade has been impacted by drought restrictions, reducing the number of vessels that can transit the canal from 36 to 32 per day.
Figure 2-3: Container Ship ‘Ever Given’ stuck in the Suez Canal, Egypt. March 24th, 2021

Changing Market Dynamics
Changes in consumer demand, shipping costs, freight modal preferences and other market factors continue to impact the way that freight is produced and delivered in Minnesota. Increased demand, particularly increased demand for e-commerce, has had an outsized impact on supply chains and freight systems. Other changes such as the development of new intermodal terminals provide additional capacity and market opportunities for Minnesota businesses.
Increased Demand
As the global economy has rebounded following the COVID-19 pandemic, latent consumer demand led to an unanticipated “demand pull” to the global supply chain system. Firms and business activities across the supply chain, from materials extraction, processing, manufacturing, inventory, warehousing and freight transportation, struggled to quickly reactivate after pandemic-related slowdowns and stoppages. Border crossings which had been closed due to public health concerns reopened with relative swiftness. Consumers with savings bolstered by stimulus payments and cutbacks on service- sector spending (restaurants, housekeeping, tours, etc.) purchased larger quantities of consumer goods. While many markets have since returned to pre- pandemic operations, some businesses in Minnesota still struggle to find reliable and affordable sources for their supply chains.
Freight Modal Balance
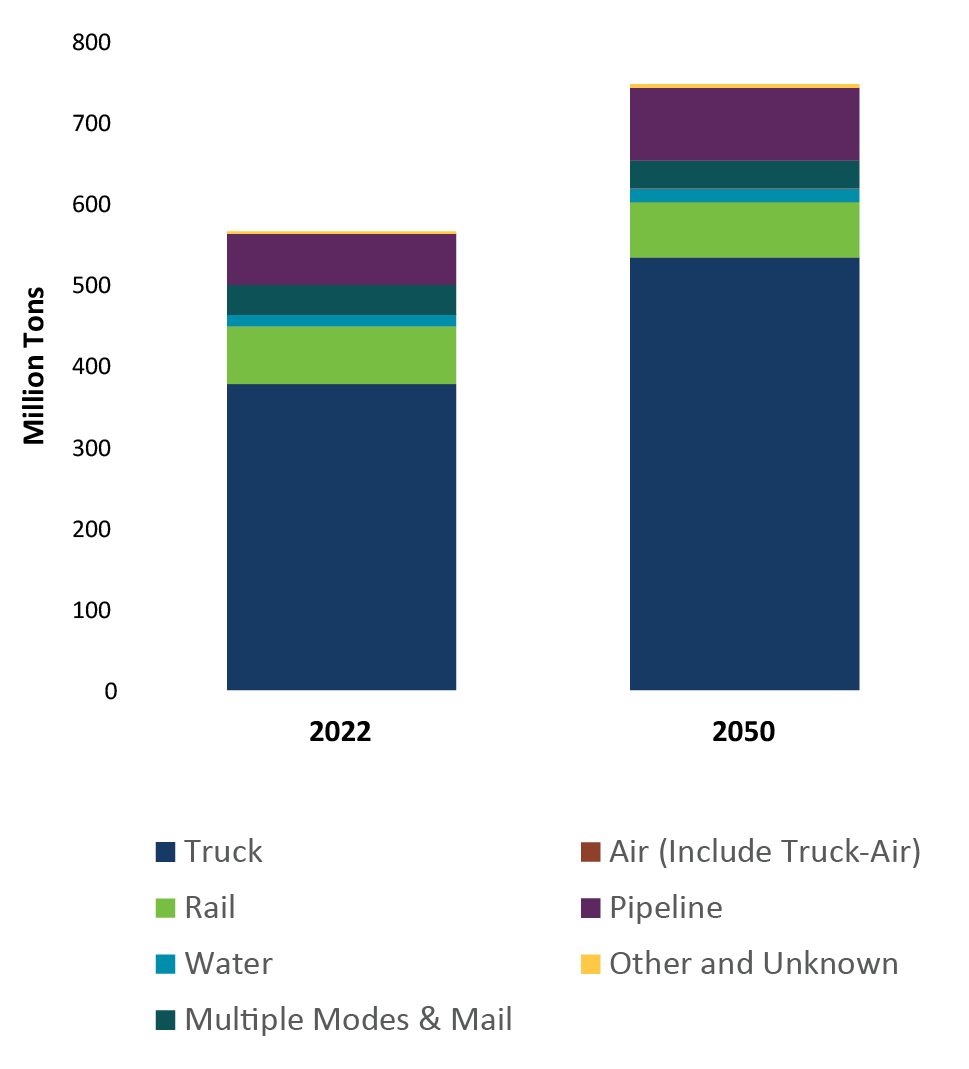
Most of the freight moved on Minnesota’s freight system is moved by truck (Figure 2-4). Forecasts of freight movements also indicate that the volume of freight moved by truck will increase both in overall tonnage and in proportion of tonnage. In 2022, an estimated 377 million tons of freight was moved from, to or within Minnesota by truck. This accounted for 66.7% of all freight movement in the state. By 2050, this volume is estimated to increase to 534 million tons, and account for 71% of all freight movements.
In alignment with MnDOT’s goals for reducing vehicle-miles traveled and greenhouse gas emissions, MnDOT incentivizes investment in nontruck freight modes through both the Minnesota Rail Service Improvement (MRSI) Program and the Minnesota Highway Freight Program (MHFP). These programs support the development of rail and intermodal services in the state.
Figure 2-4: Proportion of Freight Tonnage by Mode
Increased Shipping Costs
The COVID-19 pandemic revealed the extent to which the global economy is dependent on maritime container trade. Many of Minnesota’s distributing, wholesale and retail firms provide consumer goods which originate or pass through major international ports, such as the ports of Los Angeles, Houston, South Louisiana, Rotterdam and Shanghai. As aresult, disruptions occurring in what are perceived as “faraway” port operations can directly impact Minnesota’s freight system and economy. Shipping costs have risen throughout links of the global supply chain, often resulting in higher consumer purchase prices and market volatility for Minnesota businesses and consumers.
E-Commerce Impacts
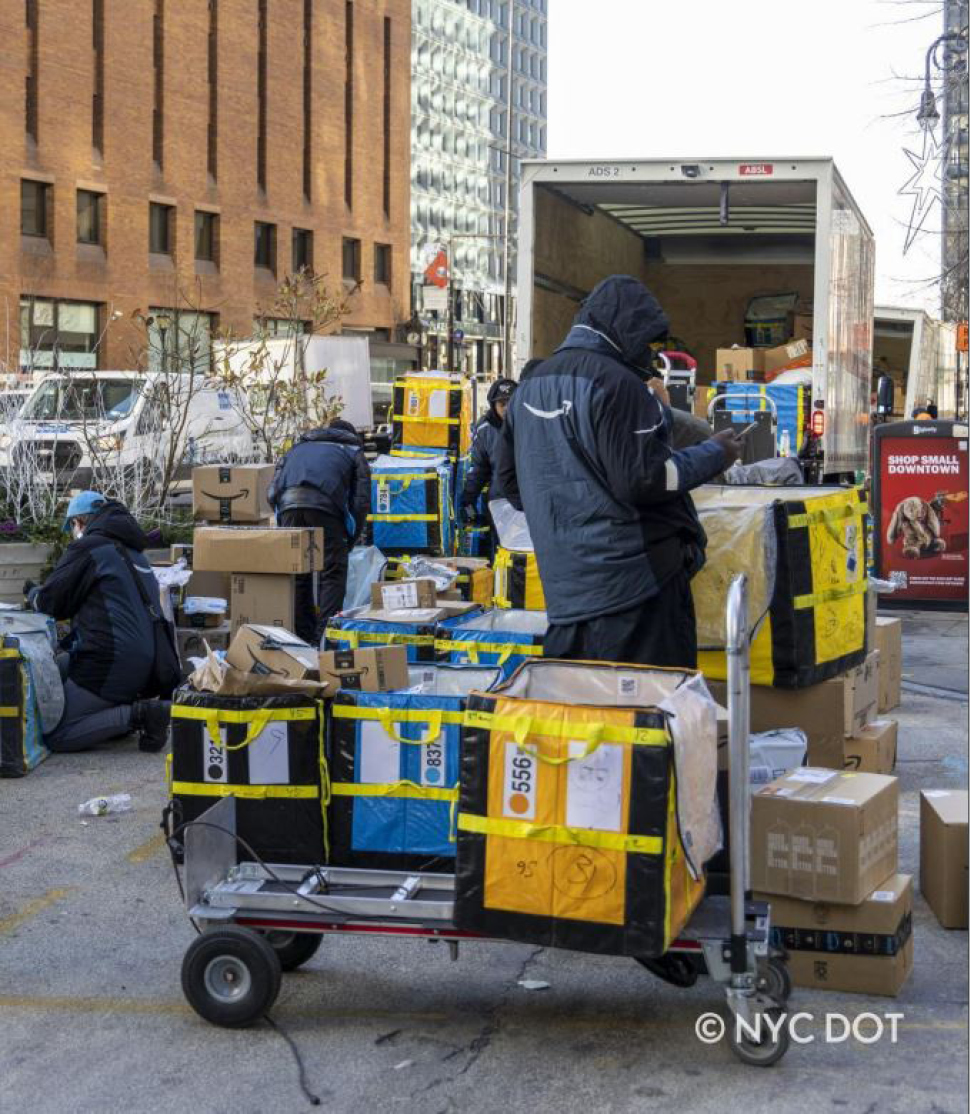
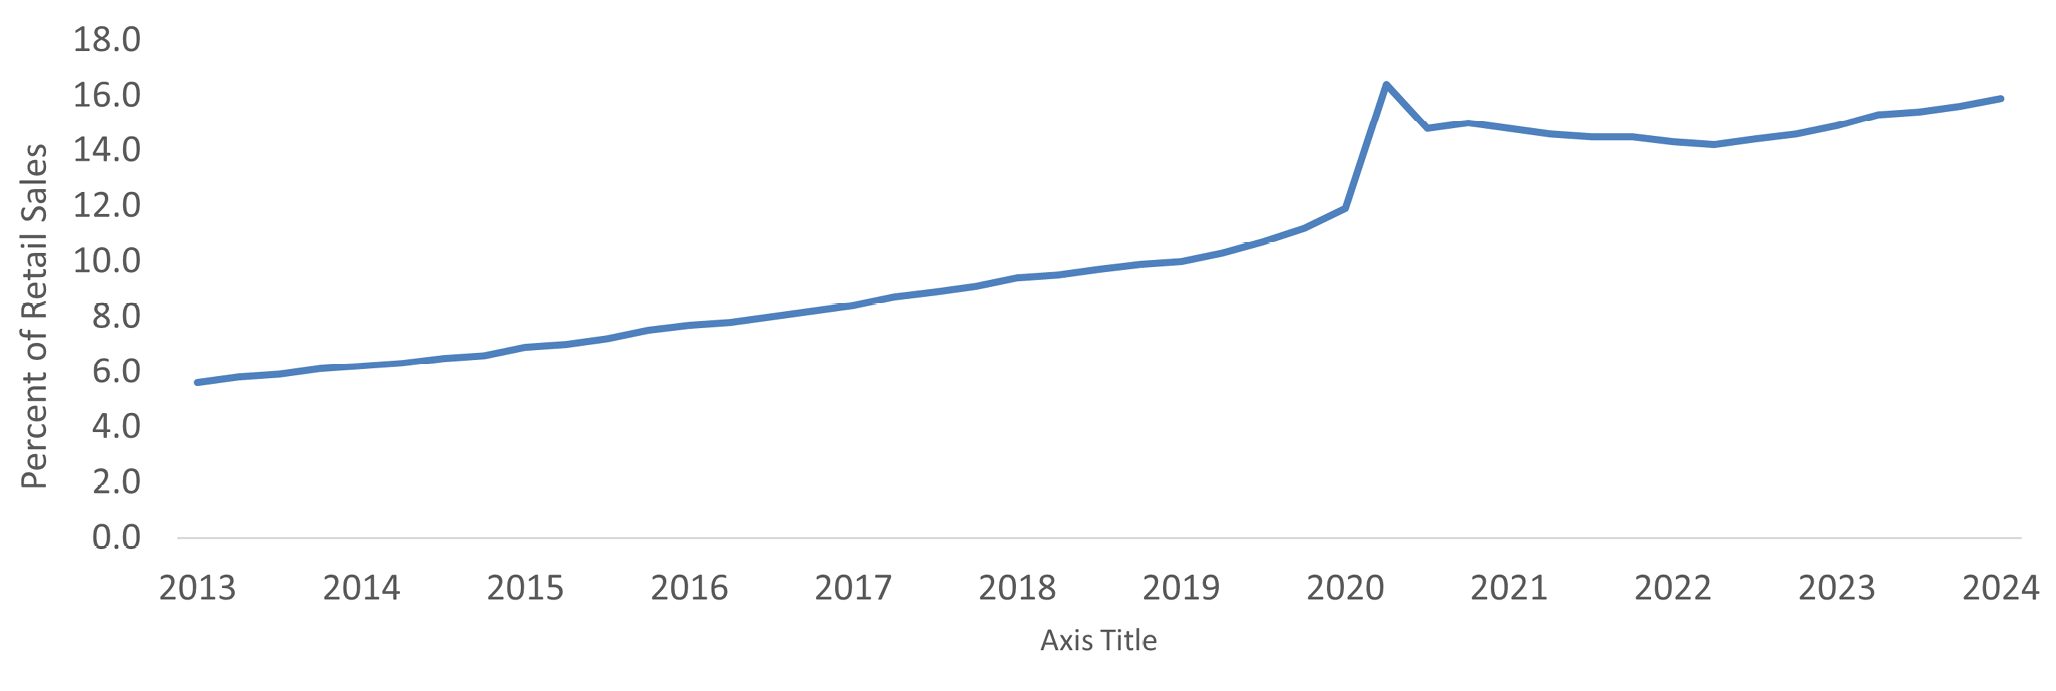
Throughout the United States, commerce and delivery practices continue to evolve. E-commerce continues to grow more rapidly across the country than overall retail growth. Total E-commerce sales for 2023 were estimated at $1.1 trillion and increase of 7.6% from 2022. As E-commerce market share and rapid fulfillment expectations have continued to grow, a shift is taking place from large delivery vehicles to smaller vans and personal vehicles. To accommodate increasing consumer demands for quicker product delivery, large regional distribution centers are supplying smaller fulfillment centers that are located within major metropolitan areas impacting land use, transportation routes and development patterns, as shown in Figure 2-5.
This increase in short-haul and last-mile truck trips further burdens national freight corridors and urban areas. The push for shorter delivery windows has increased air cargo demand while companies look for faster but less expensive methods to ship to consumers. Besides forward shipping, reverse supply chains from online returns significantly impact the national freight system.
Figure 2-5: E-Commerce as a Percentage of Retail Sales
Crude Oil Modal Shifts
At the time of the previous Statewide Freight System and Investment Plan release in 2018, the movement of crude-by-rail through Minnesota’s rail system was a strong focus of both freight analysis and the development of freight strategies and policies aimed at reducing the potential impacts of crude-by-rail movements. In response to a series of high-visibility safety incidents throughout the country, MnDOT researched the safety of crude oil by rail movements in the state by conducting a study of highway-rail grade crossings with significant safety risks due to an increase in crude-by-rail shipments. Additional funding was made available for short- term investments in rail grade crossing safety improvements.
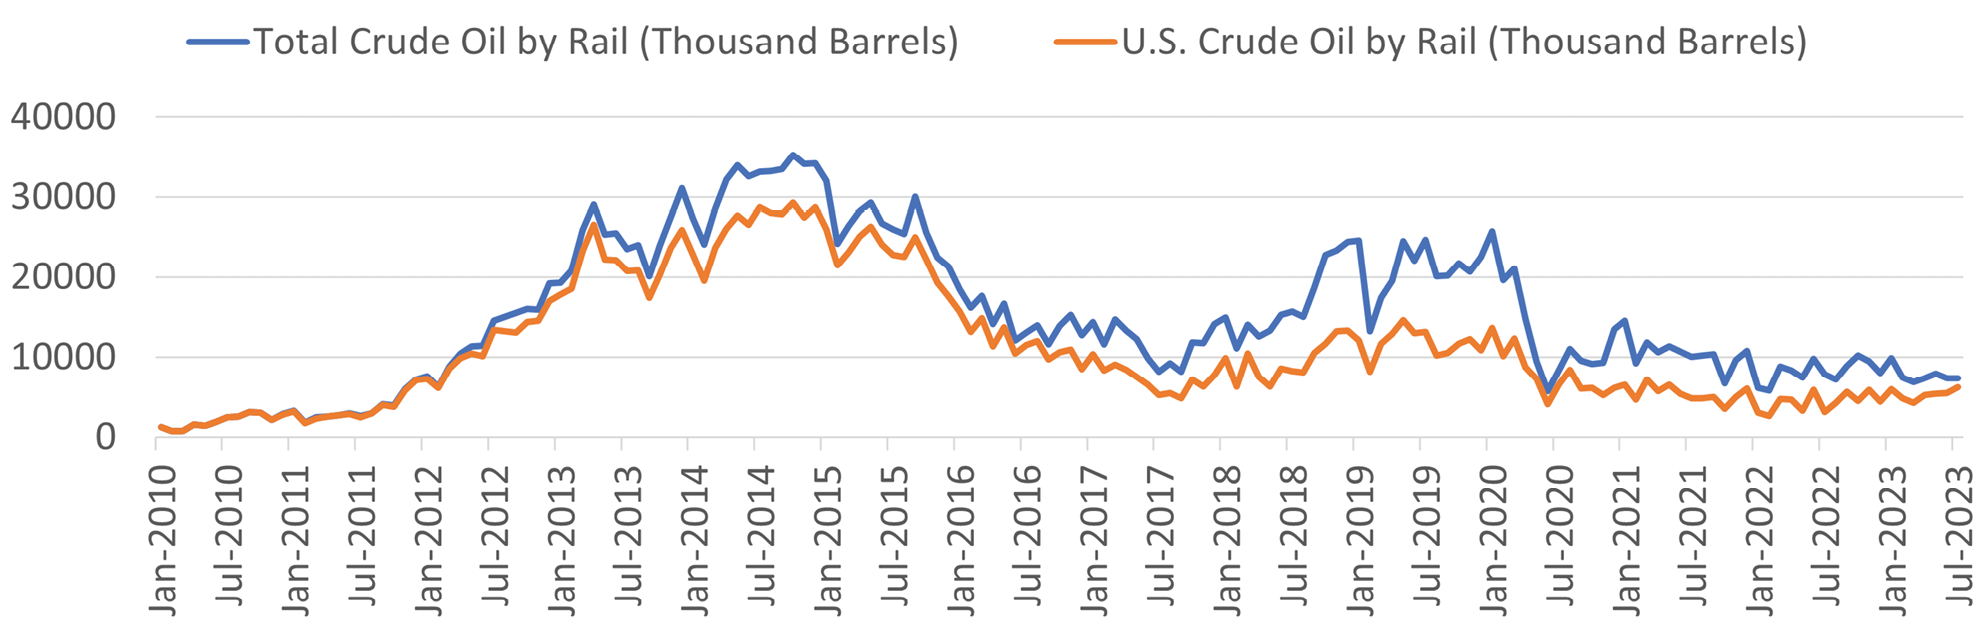
However, volumes of crude shipped via rail have dropped substantially from the peak volumes seen in 2014 and 2015. Non-U.S. crude shipped via rail is predominantly imported from Canada. After peaking in 2014 and 2015, the volume of crude by rail reduced sharply. The total volumes of crude by rail have leveled off to between 5 million and 10 million barrels per month. The reduction in crude by rail is attributed to developments in pipeline capacity, especially feeding crude south to the Gulf Coast.
Recent trends and strategies identified by MnDOT for grade crossing safety issues can be found in the Minnesota Rail Crossing Safety Action Plan, completed in 2022.
Figure 2-6: U.S. Crude Oil by Rail by Month
Truck Parking Challenges
There continues to be a nationwide shortage of parking for long-haul truck drivers. Truck parking consistently ranks in the top ten industry issues in an annual survey conducted by the American Transportation Research Institute (ATRI).
58% of all drivers admit they park in unauthorized or undesignated spots at least three times per week. Unauthorized locations include highway shoulders and highway on ramps which pose safety concerns. This is due to several factors, including an increase in the overall number of trucks on the road, limited space for parking and restrictive regulations on where trucks can park overnight. Recent industry trends and federal policy changes have increased the visibility and significance of truck parking challenges and have prompted action by both the public and private sectors, including the proposed Truck Parking Safety Improvement Act which would create a U.S. Department of Transportation (USDOT) solicitation program to provide competitive grants to states, metropolitan planning organizations, local governments and tribal governments for projects that improve the safety of commercial motor vehicle operators and provide parking for commercial motor vehicles on federal-aid highways or on a facility with reasonable access to such a highway or a freight facility.
98% of truck drivers report problems finding safe parking, costing drivers more than 56 minutes of drive time per trip, or roughly $5,500 a year – a 12% pay cut.
Truck parking needs are increasingly coming into conflict with concerns from municipalities about safety and reduced quality of life impacts. Most prominently, the cities of Minneapolis and St. Paul recently enacted restrictions for truck parking on many public streets. The Minneapolis ordinance prohibits vehicles weighing more than 6,000 pounds from parking in residential zoning districts, except when loading, unloading, or providing a service. Additionally, any vehicle weighing more than 26,000 pounds or with a registered gross weight over 26,000 pounds are not permitted to “stop, stand or park on any street” in the city unless the vehicles meet certain specified conditions.
In areas where there are not adequate truck loading/unloading zones, ramps or shipping docks, truck drivers are often forced to park their vehicles in travel lanes, bicycle facilities, shoulders or turning lanes to make their deliveries. Delivery parking can be stressful for delivery drivers, delivery receivers and other travelers near the delivery site. At the site level, improving delivery parking conditions can lead to better efficiencies, safety conditions and user experiences. Context-sensitive and thoughtful curb management design can reduce conflicts with people walking, biking, etc. near loading zones.
MN legislature recently approved funding for truck parking including $7,750,000 in fiscal year 2025 for land acquisition, predesign, design and construction of expanded truck parking at Big Spunk in Avon and Enfield Rest Areas and for the rehabilitation or replacement of truck parking information management system equipment at Department of Transportation-owned parking rest area locations. Additionally, $4,800,000 in fiscal year 2025 for predesign, design, engineering, environmental analysis and remediation, acquisition of land or permanent easements and construction of one or more truck parking safety projects for the trunk highway system in the Department of Transportation metropolitan district.
Intermodal Shipping Access
The need for improved and expanded intermodal shipping services for Minnesota has been a long- standing issue well documented in the previous Statewide Freight System and Investment Plan and in other sources. Intermodal services in the state have historically been limited to only the BNSF Intermodal facility in St. Paul and the CP Shoreham Intermodal Facility in Minneapolis. A common complaint from Minnesota shippers has been the need to travel into the Minneapolis-St. Paul metro area to access intermodal shipping options and the limited markets that are served by these facilities. The estimated truck travel time to and from the BNSF and CP intermodal yards in the metro are shown in Figure 2-6. Large portions of Minnesota are located more than a two hour drive from these facilities, particularly in the northern and southwestern portions of the state. Additionally, shipping containers are sometime unavailable for loading in Minnesota. Because of these reasons, it can often be more cost-effective and/or simply more reliable to transport goods to intermodal facilities in the Chicago region.
In recent years, three new intermodal facilities have begun operation in or near Minnesota. These include the UP Twin Cities Intermodal Terminal in St. Paul, the CN New Richmond, WI Intermodal Terminal and the CN Duluth Intermodal Terminal. Each of these new facilities provide expanded intermodal service options for Minnesota customers.
Figure 2-7: Truck Travel Time Isochrones from Twin Cities
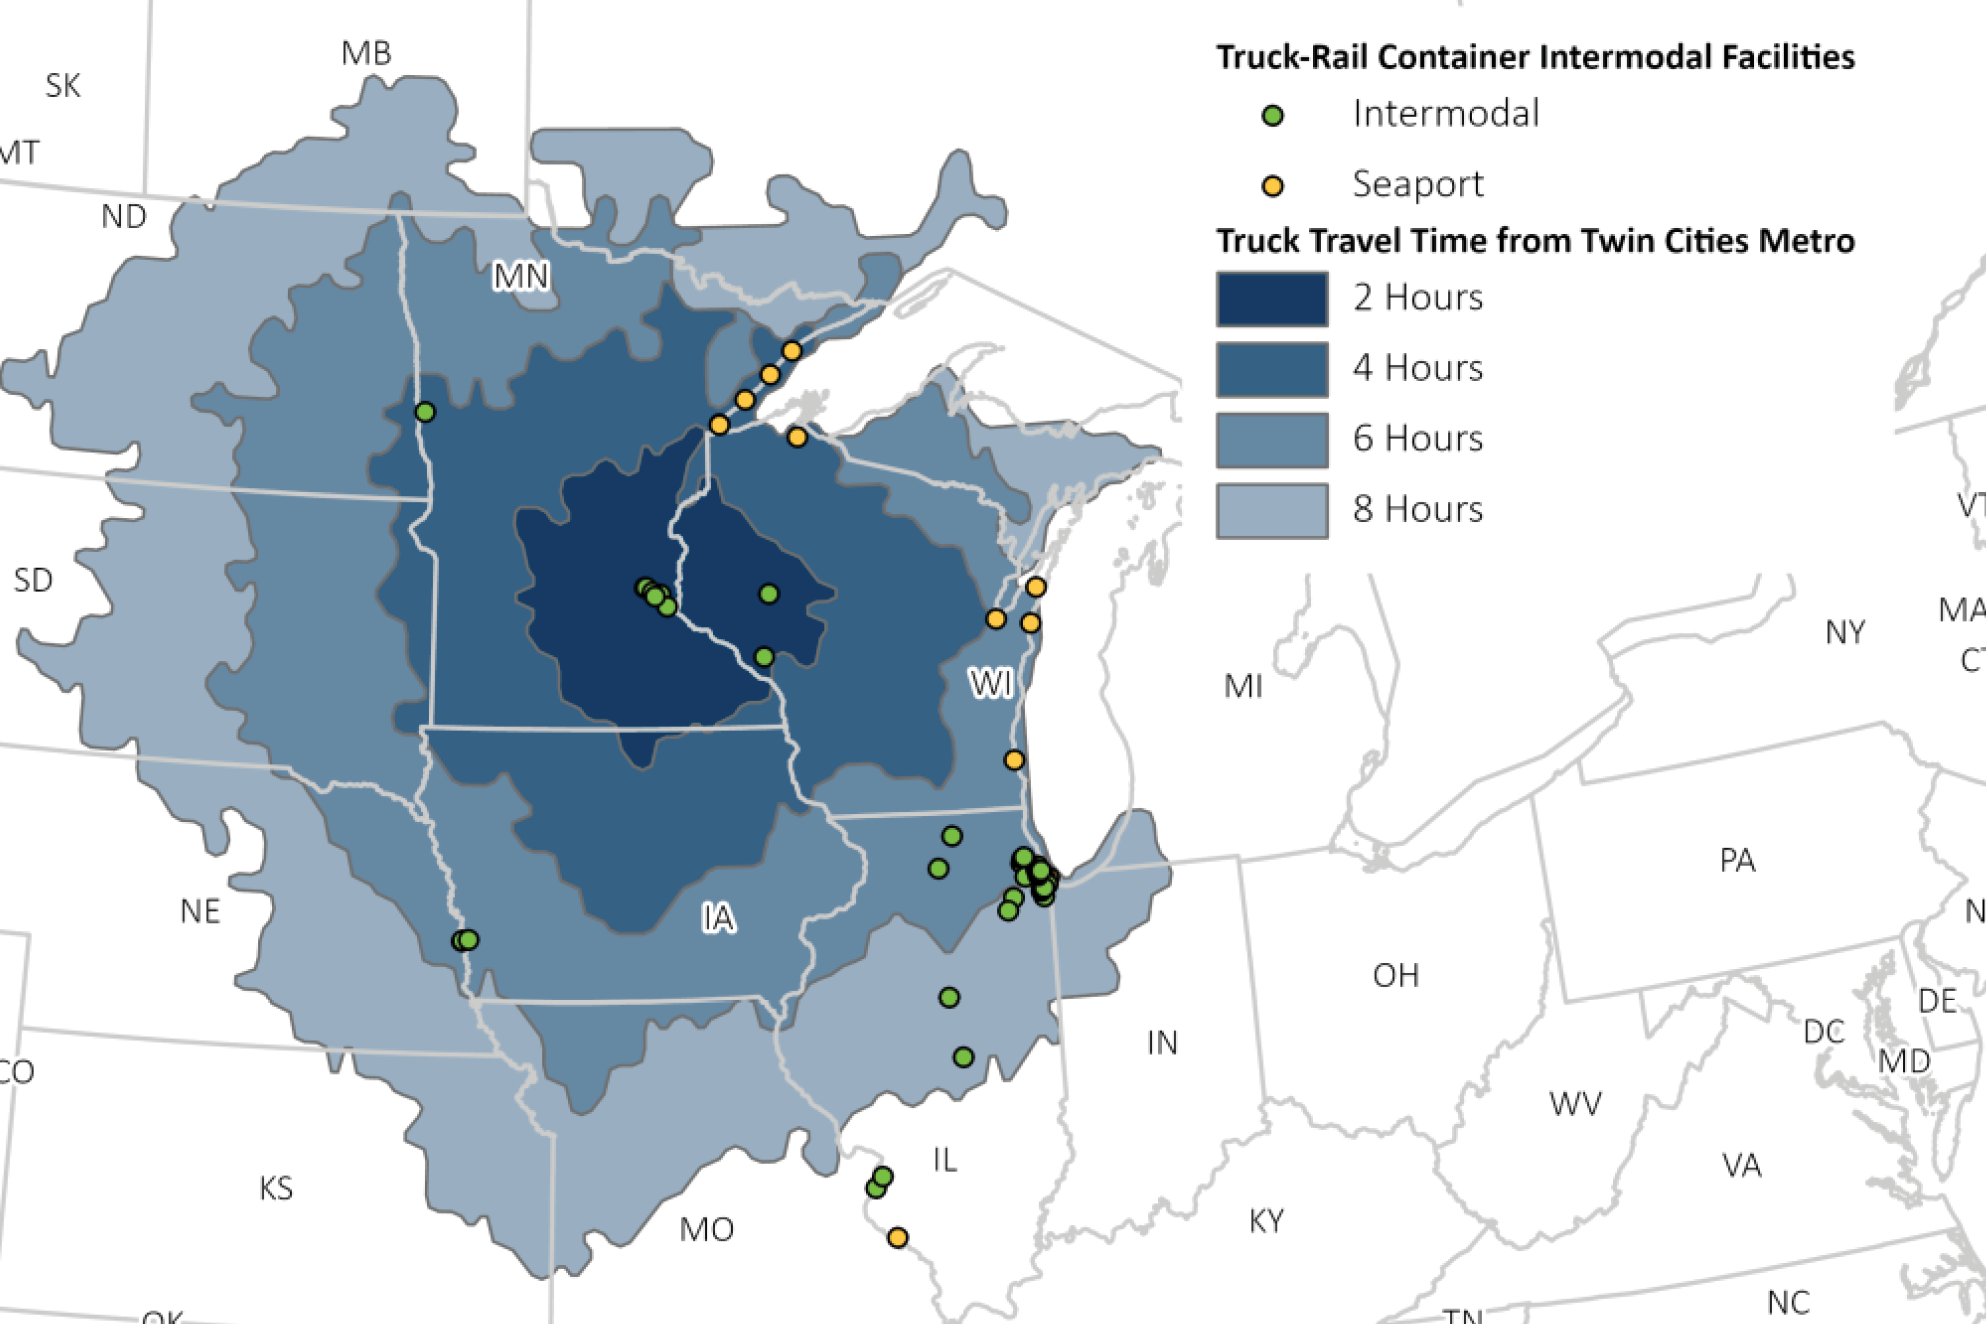
Source: HDR Travel Time Analysis Using HERE Truck Routing API
Demographic and Workforce Changes
The Minnesota State Demographic Center has identified three major demographic trends which will continue to shape the workforce and market conditions in Minnesota: population aging, shifts in the labor force and growing racial and ethnic diversity. In the coming decades, Minnesota’s workforce will be older and increasingly more racially and ethnically diverse. Each of these demographic trends will continue to impact Minnesota’s freight system now and into the future.
Aging Population
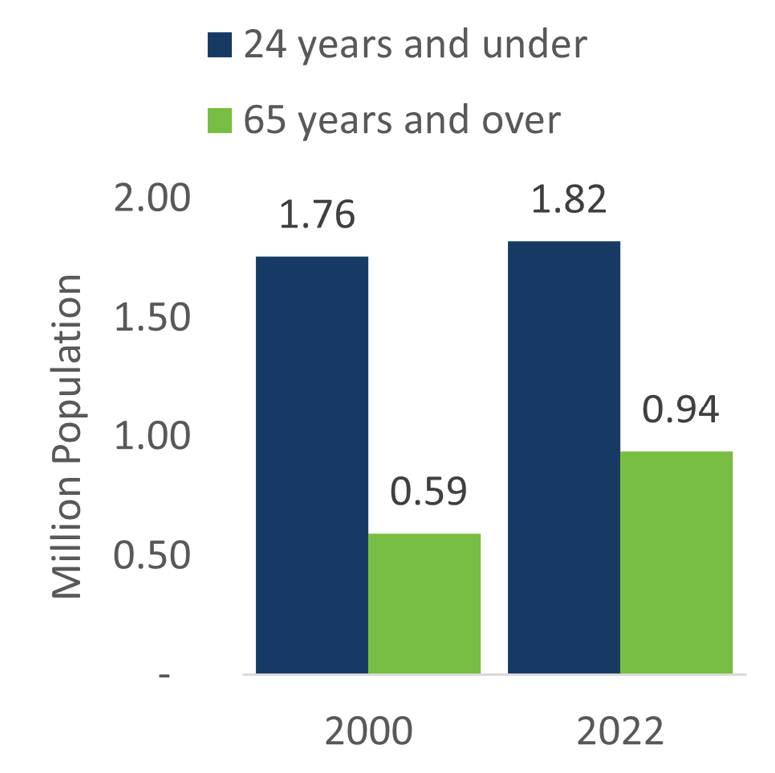
Minnesota’s population and workforce will become increasingly older, which will slow the growth of the state’s labor force. These changes are partially due to the Baby Boomer generation entering the 65+ group, as well as lengthening life expectancies. Between 2000 and 2022, the population aged 24 years and under increased by only 4%. Meanwhile, the population aged 65 years and over increased by 58%. Additionally, the Minnesota Demographic Center predicts that by the year 2050, the population aged 65 and over will increase by another 18% while the population aged under 65 will only increase by 3.7%.
As Baby Boomers increasingly press into retirement, an immediate and direct implication will be the challenge among employers to properly staff and train the workforce that will replace them. These trends will impact labor availability across a range of industries including freight. Additionally, the higher numbers of older adults and retired persons, combined with expanding e-commerce and continuing trends of these populations’ desire to “age in place” is anticipated to accelerate the proliferation of regional distribution centers, shorter deliveries, deliveries made directly to residences and deliveries performed by shuttles or smaller freight vehicles.
Between 2019 and 2028, the Minnesota population aged 25-64 is expected to be reduced by approximately 40,800 people as the Boomers transition out of this age group, replaced by the smaller Generation X within the age group. The U.S. Chamber of Commerce Worker Shortage Index shows that Minnesota has a “More Severe” worker shortage than other states with 51 available workers for every 100 job openings.
This challenge to the statewide labor market is anticipated to be felt acutely within the freight industry, particularly regarding finding and retaining truck drivers. Truck drivers as a workforce are aging out into retirement at a faster rate than they can be replaced, exacerbating the driver shortage issue.
Figure 2-8: Minnesota population 2000-2022
Workforce/Truck Driver Shortages
An additional factor impacting freight operations is a shortfall of workers relative to the positions required. This shortfall is derived from both a general worker shortage in the broader labor economy, as well as acute labor shortages in the trucking, port and airline industries. The American Trucking Association estimated that in 2021 the truck driver shortage hit a historic high of just over 80,000 drivers and could grow to 160,000 drivers by 2030. This figure is the difference between the total number of drivers currently in the market and the optimal number of drivers based on freight demand, with shortage in long-haul drivers being more acute.
This national driver shortage is reflected in Minnesota. In 2023, the Minnesota Trucking Association (MTA) reported a shortage of nearly 8,000 drivers. The MTA has identified an increase of funding for truck driver and diesel technical training as their number one 2024 legislative priority. According to the Minnesota Department of Employment and Economic Development (DEED), there will be 4,864 job openings for heavy and tractor trailer truck drivers in the next 10 years. DEED identified Transportation and Material Moving Occupations as the fifth most severely understaffed industry in the state in 2022, with a shortage of approximately 13,374 drivers.
Minnesota’s Department of Employment and Economic Development (DEED) identified “Transportation and Material Moving Occupations” as the fifth most severely understaffed industry in the state in 2022, with a shortage of approximately 13,374 drivers.
Factors contributing to low workforce include the industry’s failure to recruit more women, lifestyle disadvantages of long-haul trucking, the minimum federal driver age of 21 for interstate travel to enter the workforce and inadequate truck parking.
In 2024 the MN legislature approved a commercial driver workforce study to address commercial driver shortages in transportation and transit sectors and propose recommendations to address the challenges posed by driver shortages and the attrition rate of commercial vehicle drivers in Minnesota.
Climate Change and Equity Impacts
Ongoing climate change and more severe and unpredictable weather patterns are continuing to challenge freight operations in Minnesota. More persistent drought conditions make barge operations on the Mississippi River and abroad more difficult. At the same time, severe storms pose a safety risk to freight vehicles and infrastructure for all modes. Further, freeze and thaw cycles due to warming climate can create precarious conditions and safety issues for freight drivers and potential conflicts with passenger vehicles on roadways. Identifying projects that support freight system resiliency will be crucial for maintaining adequate freight transportation infrastructure into the future. Minnesota must also consider the environmental impacts of freight infrastructure including vehicle emissions and the potential impact to wildlife habitat.
Seasonality
Minnesota’s four-season climate presents a range of considerations for all transportation modes. Surface transportation is impacted by inclement weather, resulting in delay, safety and cargo integrity challenges. Minnesota’s ports are productive only insomuch as their contributing shipping lanes can facilitate ship passage. Each winter, port decision makers must pause and restart port operations based on weather and ice conditions. Barge operations on the Mississippi River are highly dependent on sufficient water levels for operation. Tug boat activity is often forced to operate primarily within a narrow window of mid-summer to fall due to these conditions.
Each year, MnDOT and Minnesota’s roadway jurisdictional agencies issue winter and spring load restrictions. These load restrictions specify seasonal weight limits. Motor carriers are bound by these restrictions, which regulate the maximum legal weight per axle, which dictates the maximum amount of allowable truck weight.
In this way, Minnesota’s freight system is governed to a degree by weather and temperature conditions. Changes in weather patterns have associated impacts to state freight movements. For example, as winter temperatures rise and lakes freeze over later into the year, Minnesota’s ports may continue operations for extended time periods.
Figure 2-9: Mississippi River Tug Activity by Month (2019)
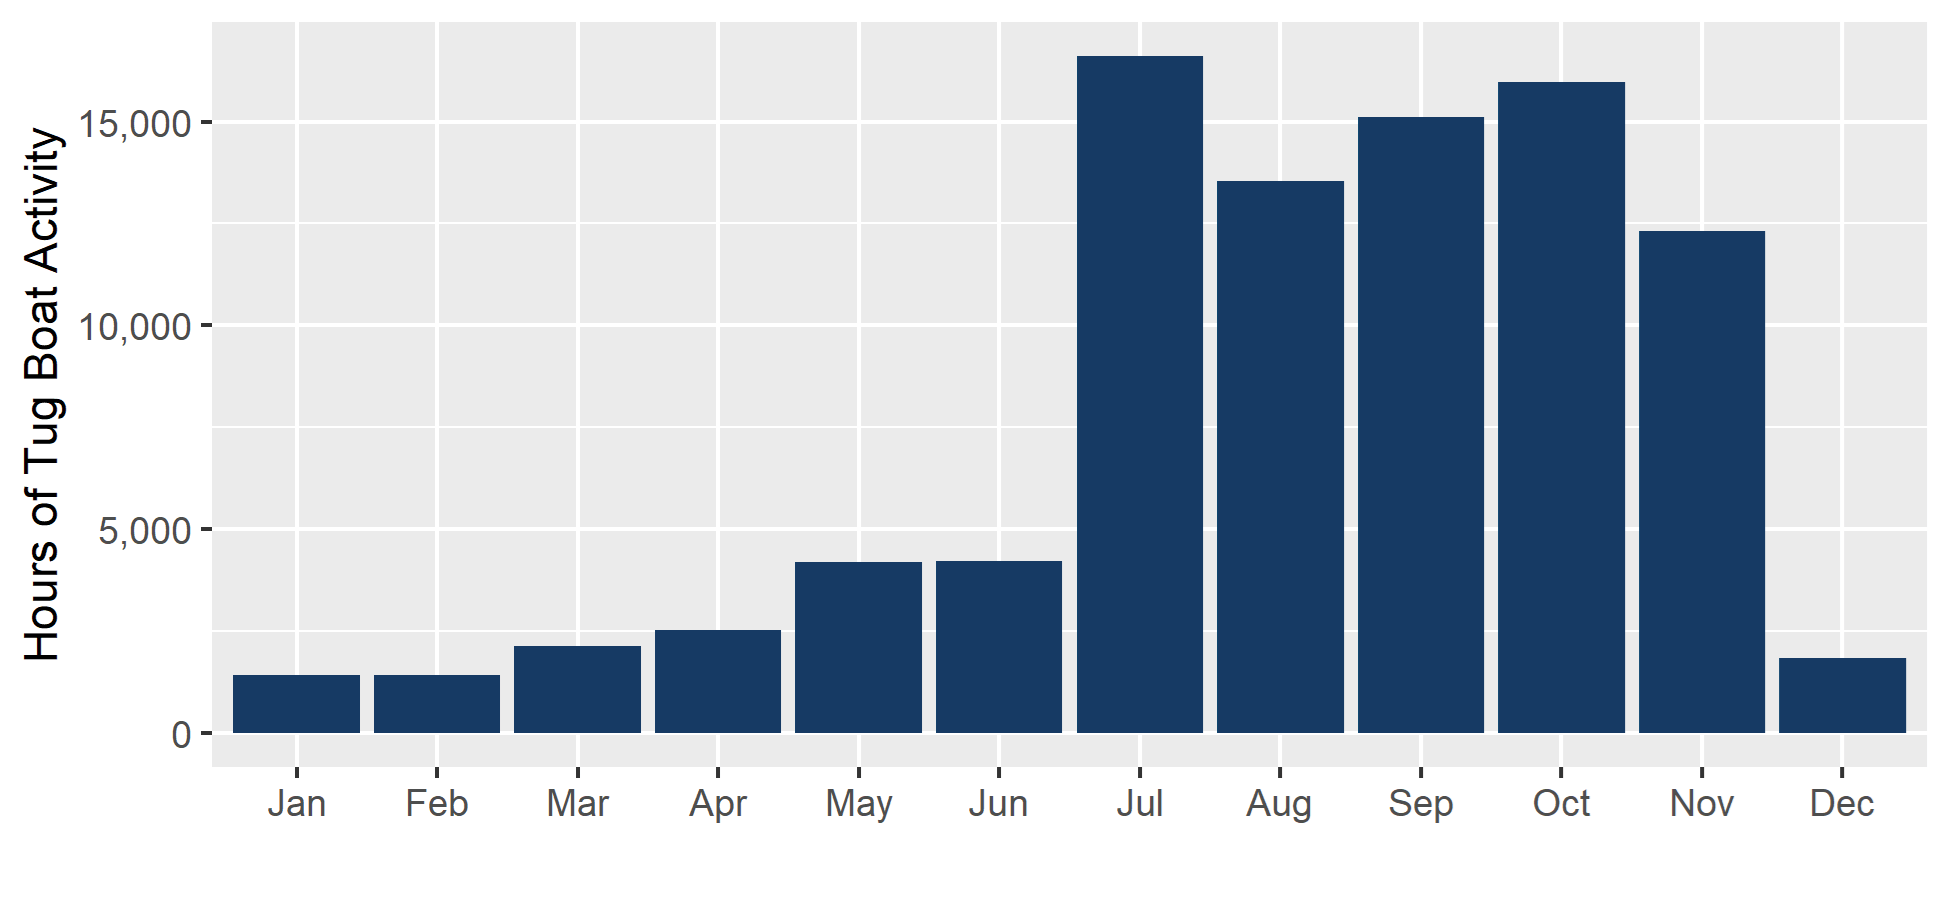
Source: MnDOT District 6 Freight Plan
Transportation Equity
Transportation equity means the benefits and burdens of transportation systems, services and spending are fair and just, which historically has not been the case. Transportation equity requires ensuring underserved communities, especially Black, Indigenous and People of Color (BIPOC), share in the power of decision making. MnDOT’s commitment to transportation equity is intended to identify and address the needs of those who have been underserved and underrepresented in transportation and other infrastructure decisionmaking processes.
MnDOT has embraced the goal of transportation equity during the development of this plan through a robust public engagement campaign that sought to engage with Minnesotans from all walks of life. This was achieved through using a variety of tools including online and in-person meetings and one-on- one interactions. In total, more than 1,300 interactions were recorded and incorporated into this plan. Additional details can be found in Working Paper 8: Stakeholder Engagement Summary
In addition to this outreach, MnDOT also completed an Environmental Justice analysis to evaluate the potential impacts of the freight system on overburdened and underserved communities. This is discussed in further detail in the next section.
Environmental Justice Evaluation
Environmental justice (EJ) examines the benefits and burdens of an action to the local community and informs the recommendation of mitigation strategies that best reflect the needs and concerns of the community. Incorporating an EJ evaluation into freight-related strategies and policies is important to inform the development of planned improvements with consideration of improving the quality of life of these communities. As part of its commitment to equity and EJ, MnDOT completed an EJ evaluation to consider these impacts and to propose strategies for avoiding, minimizing, or mitigating these potential impacts.
Freight operations can significantly impact the health, safety and livability of communities. History presents many examples of highway investment decisions which have followed financial and political incentives to locate infrastructure in communities with lower levels of income and political capital. Recent decades have seen a renewed focus toward advancing equity and EJ when making infrastructure investment decisions. Issues of equity and EJ are now at the forefront of planning decision-making, as planners and policymakers now place prime importance on understanding both the direct and indirect impacts of transportation infrastructure investment decisions. MnDOT supports EJ through every stage of planning, construction and maintenance processes. This ensures MnDOT gains input from the community to help shape how infrastructure is built and maintained. MnDOT’s agency-wide identified strategies to incorporate EJ are:
- Avoid, minimize, or mitigate disproportionately high and adverse human health and environmental effects, including social and economic effects, on minority populations and low-income populations.
- Ensure the full and fair participation by all potentially affected communities in the transportation decision-making process.
- Prevent the denial of, reduction in, or significant delay in the receipt of benefits by minority and low-income populations.
Key Findings
Adverse Impacts
Volumes of average daily heavy commercial traffic are higher in the Metro area compared to other locations in the state. In combination with other sources, this leads to higher levels of diesel particulate matter, PM2.5, and ozone pollutants being more highly concentrated in the Minneapolis-St. Paul region. This is reflected in the higher risk of cancer and respiratory illnesses due to air toxins in the Metro area, which has census tracts with a high percentage of people of color and individuals living in poverty.
Roadways with higher levels of truck congestion and travel time reliability indices are also more likely to be located adjacent to these census tracts. Finally, public at-grade highway-rail crossings are more likely to be used by populations of color and these crashes are also more likely to result in fatal and severe injury compared to other crossings in the state.
In Minnesota, POC populations experience higher levels of PM 2.5 concentrations compared to non-POC populations.
- POC PM 2.5 average: 7.02 micrograms / cubic meter
- Non-POC PM 2.5 average: 6.57 micrograms / cubic meter
Figure 2-10: Concentrations of Particulate Matter Near EJ Areas

Benefits to Communities
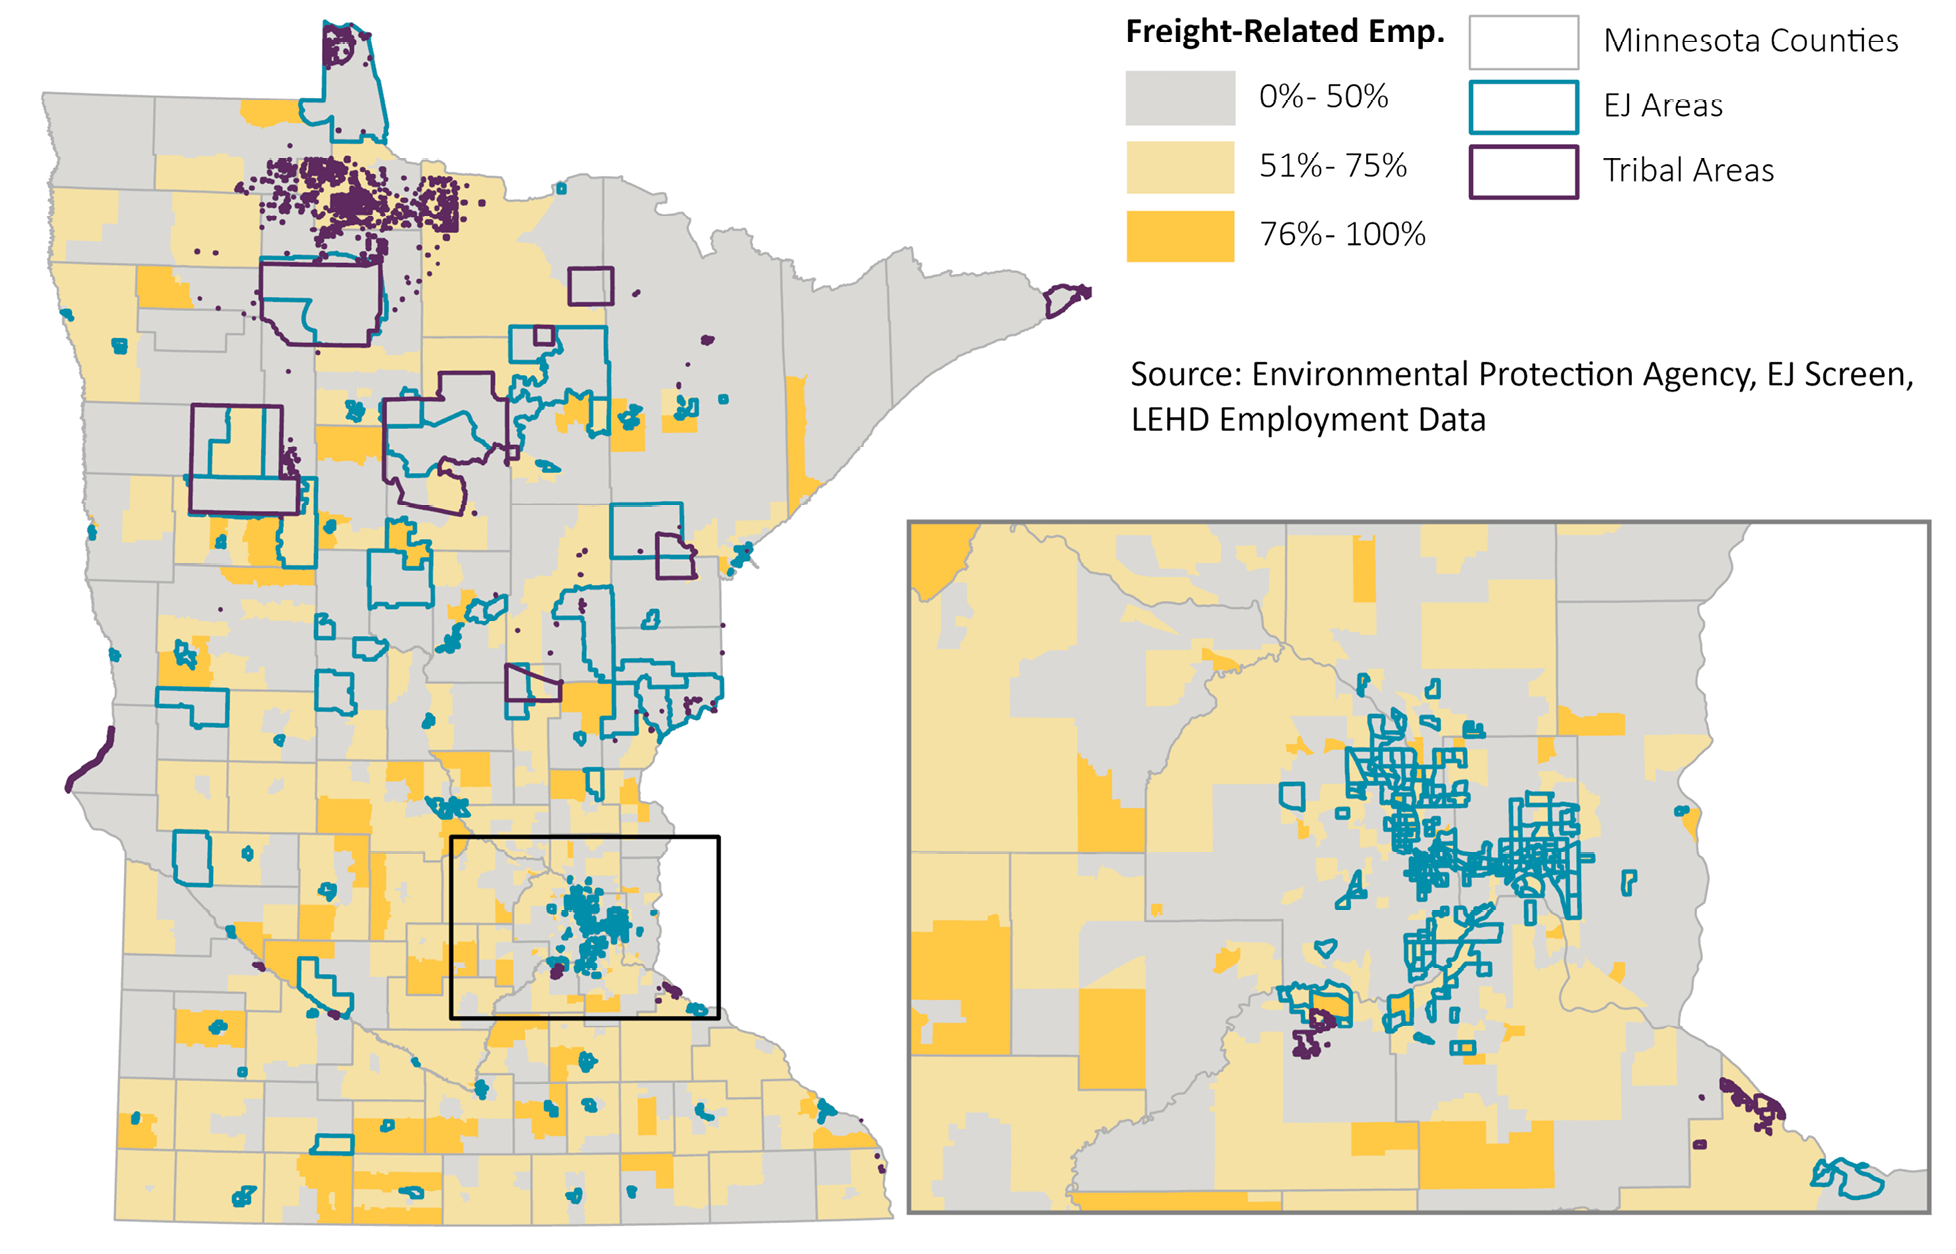
Freight-related industries accounted for 35% of the statewide share of jobs in 2021 and employment in Agriculture, Manufacturing, Transportation, and Warehousing have high proportions of EJ populations in the workforce. There is a high number of freight-related employment in Hennepin, Anoka, and Ramsey counties, which have census tracts with EJ concerns.
While the location of freight industries provides many employment opportunities to the surrounding communities, this must be balanced with consideration for the potential adverse impacts to noise, air quality, and safety in these same communities.
In Minnesota, POC populations are more likely to reside in areas with a higher proportion of freight-related employment compared to non-POC populations.
Figure 2-11: Concentrations of Freight-Related Employment Near EJ Areas
Strategies and Policy Considerations
The following strategies and policies for addressing the state’s freight transportation environmental justice challenges were recommended during the EJ evaluation:
- Avoid disproportionate impacts on communities with EJ concerns: In planning and delivering specific improvements to the freight network, consider the environmental and public health costs and effects on diverse types of communities that are experiencing burdens, such as mobility challenges, low-incomes, language limitations, poor health, among others.
- Prioritize benefits to communities with EJ concerns: While all populations should experience the benefits if infrastructure investments, per Justice40 discussed herein, it is imperative to proactively meet a goal of 40 percent of project benefits realized by disadvantage communities.
- Define indicators related to freight activity, safety, and congestion and reliability: Tracking indicators over time can help communities better understand where its efforts need to be focused and proactively address EJ concerns.
- Enhance efforts to improve at-grade crossing safety in communities with EJ concerns: Safety is a key priority and should be prioritized in communities that have experienced higher numbers of incidents, which often are in EJ communities.
Additional analysis and discussion on the intersection of freight and environmental justice issues can be found in Working Paper 6: Environmental Justice Analysis.
Mississippi Low-Water Drought
In September 2022, low water drought conditions began to be experienced throughout the Mississippi River Basin. These historic river lows stranded barges, delayed shipments and resulted in draft restrictions leading to less cargo loaded to each barge. Normal operations resumed in February 2024, when USACE announced all draft restrictions had been lifted.
Waiting times for vessels increased, resulting in ship owners shifting to alternative lengthier routes affecting transportations costs. Combined with the Panama Canal drought issues and other environmental effects there are concerns for prolonged drought which result in further maritime trade disruptions due to climate change which could continue to impact freight movement in the future.
Alternative Fuels
A range of incentives continue to drive advancements in fuel diversification away from the traditional gasoline-powered internal combustion engine. Fuel alternatives include biofuels, liquefied natural gas (LNG) and compressed natural gas (CNG), hydrogen and the accelerating integration of batteries capable of drawing power from a range of renewable sources, including solar, wind and hydraulic power.
National trends such as an increasing supply of domestically produced natural gas, higher diesel fuel and gasoline prices, environmental regulations and growing interest in natural gas, hydrogen and electricity as alternative fuel sources may drive the conversion of truck fleets to alternative fuels in the long-term, but short-term conversions will likely remain limited. Heavier engines (that limit the potential commodity load), higher initial purchase price, lower fuel efficiency, higher maintenance costs and limited infrastructure are other factors that currently inhibit conversion of the truck fleet to alternative fuels.
Innovative Technologies
A wide variety of new technologies and innovations are currently being developed to improve the efficiency, reliability and safety of the freight transportation system. These range from the use of tracking technology to improve the customer experience to the development of self-driving vehicles that promise to substantially reduce the cost of operations in the long-term and the development of freight network optimization models as directed by legislature. Staying abreast of the current technological improvements will help MnDOT to best prepare for adoption and implementation of systems and technologies.
Connected / Automated Vehicles
Connected and/or Automated Vehicle (CAV) technologies continue to rapidly advance. MnDOT’s Office of Connected and Automated Vehicles (CAV-X) recognizes that CAV technologies hold the potential to support freight transportation in a range of ways, including safety, expanding freight options, improving freight efficiencies and reducing congestion. CAV technologies hold the potential to improve safety via crash reductions, improve carrying capacities and enhance mobility for all transportation users. The U.S. Department of Transportation (USDOT) and the National Highway Traffic Safety Administration (NHTSA) are pursuing the implementation of CAV technologies, which hold the potential to further improve the safety of Minnesota’s freight system. Fully automated freight trucks without a driver are being tested but are not widespread, permitted, nor fully proven.
Minnesota is among many states in various stages of testing CAV technologies and their associated integration with existing roadway operations. There is a wide diversity in approaches by different states, municipalities and context in a nationwide series of dynamic demonstrations and licensing processes. This includes a range of testing efforts for automated passenger vehicles throughout the state, including in Monticello, Rochester, White Bear Lake and Grand Rapids. While not specific to freight, these efforts will help set the groundwork for later implementation of automated fright solutions. Decisions on the appropriate implementation of Connected and Automated vehicles in Minnesota will need to be based on thoroughly vetted data- driven decisions.
Drone / Automated Delivery
The nature of freight deliveries continues to change in both urban and rural settings. Drones, or Unmanned Aerial Vehicles (UAVs) and robots, or Personal Delivery Devices (PDDs), are being tested to fulfill last-mile delivery needs. However, UAV and PDD delivery faces some challenges in their early stages. These include the payload UAVs and PDDs can carry (currently drones can carry up to 1-4 pounds of weight), the safety of the landing area and delivery, ability of PDDs to yield to pedestrians and cyclists, the security of the system controlling UAVs and regulations on where these vehicles can operate. Benefits include significant fuel/time savings for parcel delivery services and a reduction in costs for maintenance of unpaved roads to rural counties.
There are a few State drone laws in Minnesota including Minnesota Administrative Rules Chapter 8800, Aeronautics which requires all commercial drone operators to pay a licensing fee to obtain a Commercial Operations License, Minnesota Statute 360.59 which requires commercial operators to hold drone insurance and Minnesota Statute 360.60 which requires commercial operators to register their drone with the MnDOT. The typical last-mile drone emits much less noise, CO2 and particulate matter than heavy-or mid-size trucks. MnDOT will explore the potential utilization of drones of this type for last-mile deliveries may enact less noise and air-quality burdens on final consumers, thereby advancing state goals toward climate impact and transportation equity.
Truck Platooning
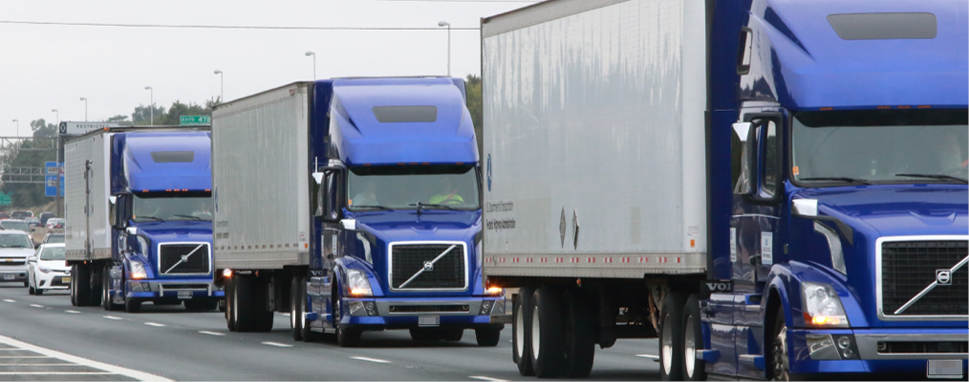
Truck platooning refers to computer synchronization between multiple freight trucks to allow them to operate close together, one behind another, as shown in Figure 2-12. The system communicates with the trucks to align speed, acceleration and braking. Drivers steer, observe the system and intervene when needed. This practice improves fuel economy for platooned trucks, however most of the efficiency gains are afforded to the rear truck(s). The practice of platooning has been successfully tested on public roadways but is still not widespread nor fully proven. Driver-Assistive Truck Platooning (DATP) is the first iteration of truck platooning.
Minnesota state law permits up to three trucks in a platoon. State statute stipulates that each vehicle in the platoon must have a driver in the driver’s seat. The driver tracks the truck’s performance and must hold a valid driver’s license for the vehicle. In 2019, the Minnesota Legislature passed legislation to direct how vehicle platoons are operated in the state (Statute 169.881). Key elements of the law include:
- Platooning is only allowed on freeways and expressways.
- Interested parties must submit a vehicle platoon plan to MnDOT for review and approval prior to operating a vehicle platoon on Minnesota roadways.
- The basic information required to be in any vehicle platoon plan is outlined in the statute. However, MnDOT may choose to require additional information.
- MnDOT has the authority to approve or deny vehicle platoon plans.
A recent platooning plan in Minnesota took place over 2022-2023, routing from Mankato to Madelia along Trunk Highway 60. This platoon consisted of two commercial trucks with approximately 50 feet between them, for an approximate 210-foot-long platoon.
Figure 2-12: Truck Platooning Examples
Big Data
The term “Big Data” refers to very large data sets that may be analyzed to reveal patterns, trends and associations. A range of emerging traffic analytics software and services are available to freight practitioners. StreetLight and Replica are data vendors that allow for a wide range of analyses, including speeds, origin-destination (O-D) and routing. Software applications are in use which aid truck operations, including Trucker’s Friend, Park My Truck App, TruckSmart, MyPilot and Trucker Path.
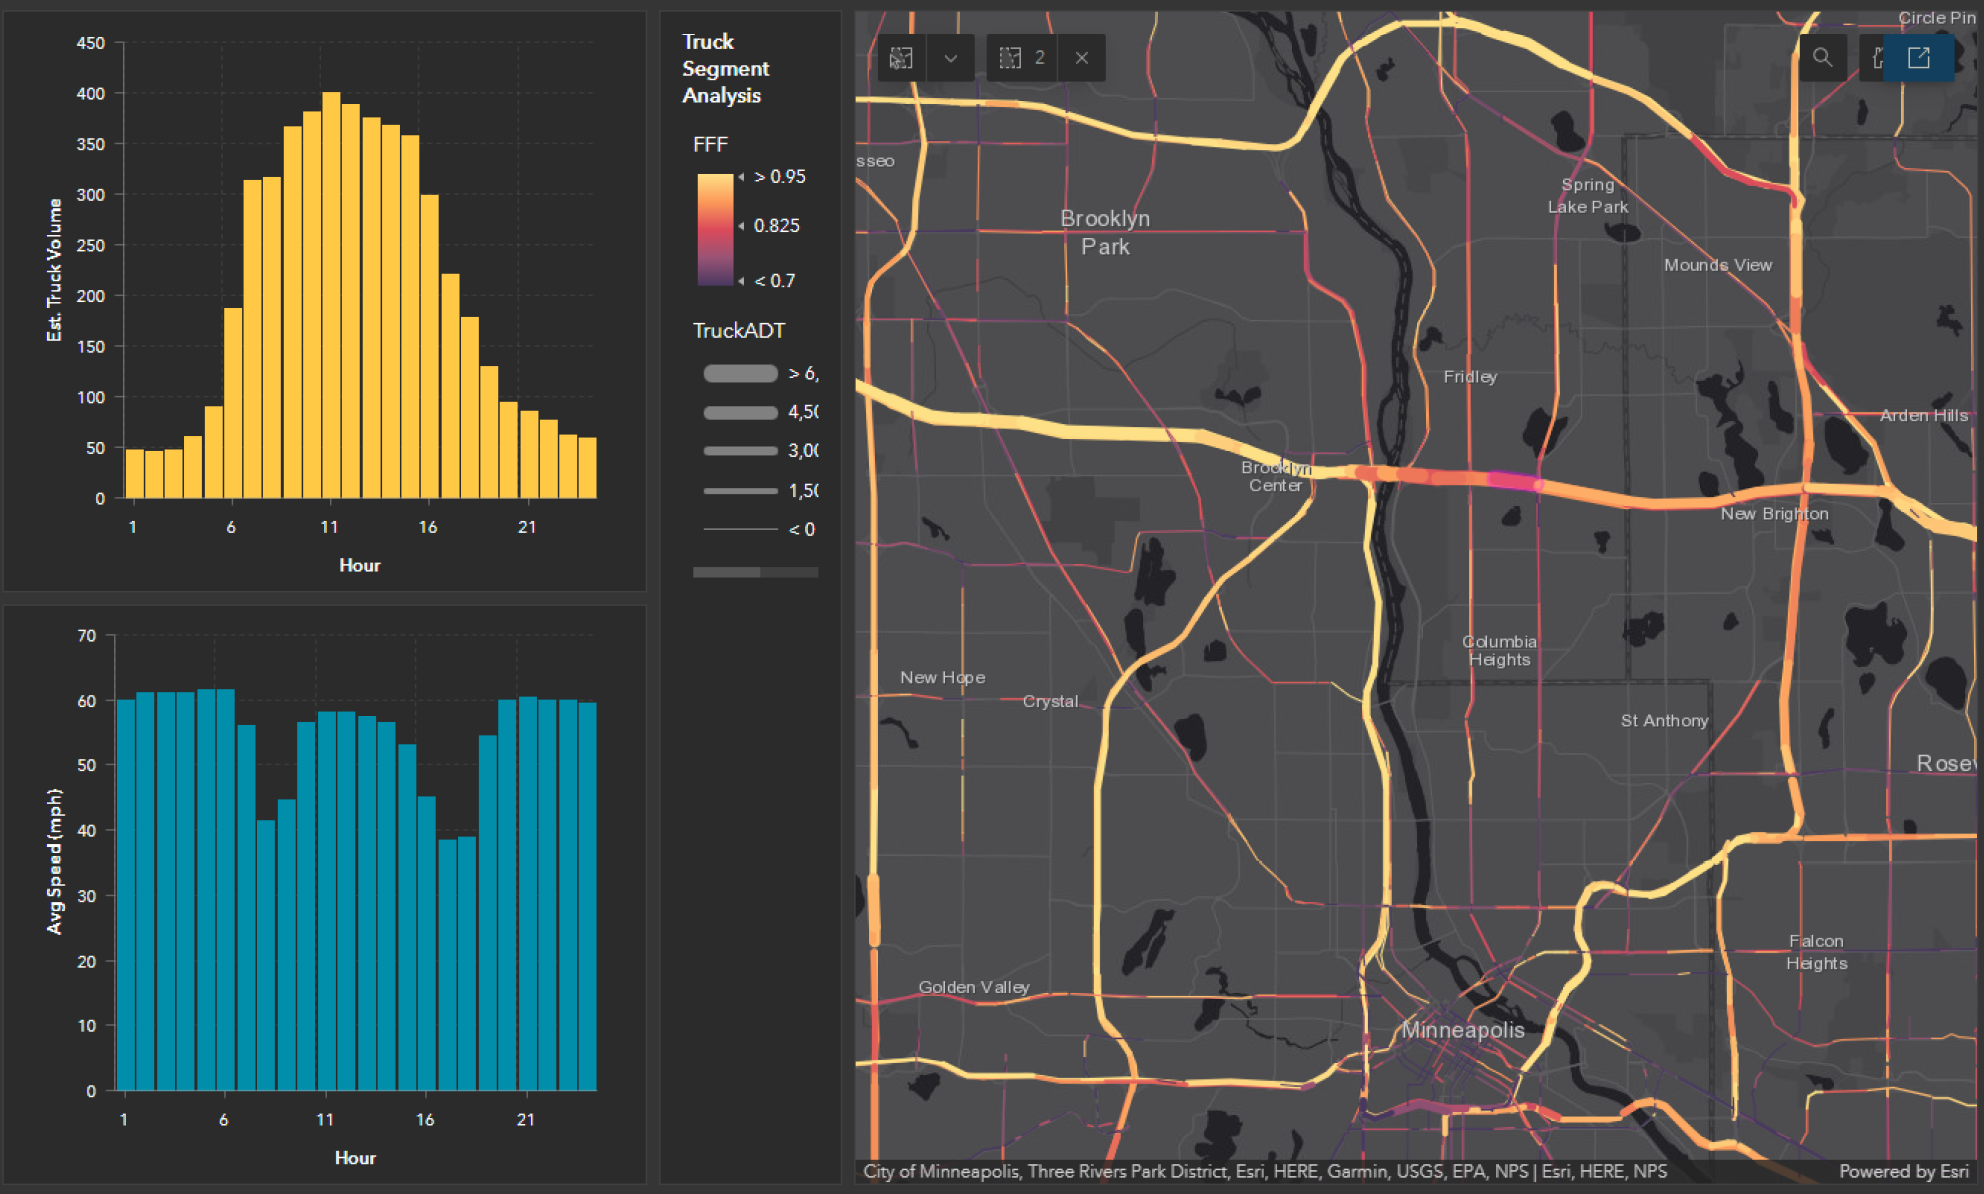
MnDOT maintains a StreetLight Insight license that provides vehicle GIS tracking (‘probe’) data for a variety of projects. The platform has been used to collect information to help with corridor studies, speed studies, origin-designation analysis and turning movement counts. It’s also used for freight-focused studies, like the data dashboard for the Metro District Urban Freight Perspectives Study. It was used to estimate the demographics of highway-rail grade crossing users for the purpose of conducting an environmental justice analysis for the MnDOT Rail Grade Crossing State Action Plan. MnDOT has developed a range of studies and research exploring the utility of big data to meet transportation goals. These include research into volume estimates and ongoing partnerships with firms specializing in traffic data analytics. MnDOT planners, engineers and policymakers utilize Big Data to better understand travel patterns for integration into ongoing studies, research and policy.
Big Data tools also serve as flexible scenario- testing instruments with a goal toward optimizing freight transportation movements and resources. MnDOT is currently exploring the development and implementation of a Freight Network Optimization Tool and would use a combination of data sources to create models to reduce transportation inefficiencies, develop return on investment metrics and analyze site locations for economic development opportunities.
Figure 2-13: StreetLight Truck Data Dashboard
Commercial Cargo Bicycles Adoption
Commercial cargo electric bicycles (e-bikes) are an emerging trend among carriers and other businesses as an alternative freight delivery mode. Carriers may opt to replace freight trips, usually last-mile trips in dense urban areas, typically made by commercial delivery vehicles (such as sprinter vans) with commercial cargo e-bike trips. There is an increased interest in and need from a range of freight system stakeholders—including carriers, shippers, receivers, government bodies and communities—for the utilization of alternative freight modes.
The advantages of employing commercial cargo e-bikes for freight trips include benefits such as:
- Transportation operations:
- Commercial cargo e-bikes can utilize both road right-of-way and bike paths,
- usually occupy a smaller road and parking footprint than typical commercial delivery vehicles used in urban freight delivery,
- and can park closer to loading/unloading sites and park for less time.
- Safety: Their size, lighter weight and slower speeds make them safer for other street-users.
- Climate change: Commercial cargo e-bikes produce no greenhouse gas emissions and can be charged utilizing renewable energy sources.
- Health, equity and environmental justice: Swapping a typical commercial delivery vehicle with a commercial cargo e-bike precludes emissions, contributing positively to air quality and health outcomes.
- Cost savings: Commercial cargo e-bikes cost less than commercial delivery vehicles.
A diverse range of public and private stakeholders support commercial cargo e-bikes as one strategy to address several current issues in transportation and freight systems. These include reducing emissions and noise impacts to communities, reducing externalized energy costs and supporting physical health.
Commercial cargo e-bikes also have limitations as well, these include:
- Limited size and weight capacity compared to parcel delivery vans or trucks.
- Limited daily range.
- Require good weather to operate effectively.
- Small parcel focused—large/bulky goods must be moved by other modes.
- Current road infrastructure may not include the most suitable infrastructure like bike lanes, curb loading zones or bike parking.
Based on the analysis conducted within the State Freight Plan as part Chapter 3 – Minnesota’s Freight System Assets, Conditions and Performance and Chapter 4 – Freight Forecasts, commercial cargo e-bikes cannot replace semi-trucks, railroads or other key freight service providers in Minnesota’s Statewide Freight Network. Rather, commercial cargo e-bikes can serve as cooperative partner and augmenter to replace certain key final mile delivery services particularly for parcel delivery companies and local businesses.
Figure 2-14: Cargo Bike Example

Commercial Cargo Bikes Implementation and Support
MnDOT will continue to explore how commercial cargo e-bikes can support state goals around climate change, economic development, safety and equity. In alignment with MnDOT’s Carbon Emissions Reduction Strategy, MnDOT is currently working to better understand potential models of implementation of commercial cargo e-bikes in Minnesota.
MnDOT initially explored conducting a subsidized commercial cargo e-bike demonstration project in 2024. MnDOT completed interviews with existing communities that have implemented commercial cargo e-bikes including Seattle and Boston as well as cargo bicycle manufacturers and others to understand potential lessons learned and limitations of commercial cargo e-bike demonstration projects. Through these interviews it was identified that the Twin Cities metropolitan area likely does not have the density to support commercial cargo e-bike service using existing traditional service models without significant public subsidies.
For these reasons, MnDOT will continue to have peer conversations with cities or agencies that have developed commercial cargo e-bike programs, and further research various aspects of commercial cargo e-bike adoption, to better understand the role MnDOT can play in their development. Particularly, MnDOT is exploring new business models and use cases for commercial cargo e-bikes to better understand potential opportunities to implement commercial cargo e-bikes as commercial delivery vehicles in the local freight system. During the period of development of the State Freight Plan MnDOT has submitted two National Cooperative Highway Research Program (NCHRP) Domestic Scans to identify vehicle types that could be replaced by commercial cargo e-bikes in successful business models and vehicle classifications in state and local laws for commercial cargo e-bikes.
Parcel Consolidation and Microhubs
Under the traditional freight distribution system, delivery of goods to consumers relies on small to medium trucks and vans to travel the final leg of the journey between the warehouse and the final destination. In dense urban neighborhoods, this reliance on larger vehicles can cause conflict with other roadway users. Limited curb space means these delivery vehicles are often forced to park in ways that block bike lanes, impede traffic flow, and reduce parking availability. Use of these vehicles can also lead to impacts on air quality, noise, and safety in areas that may have higher proportions of environmental justice populations. Parcel consolidation and microhubs are two strategies that may be used to reduce and mitigate these issues.
Parcel consolidation is the strategy of combining smaller shipments into a single larger package. The benefits of this approach are that it can reduce costs, streamline the delivery process, and reduce the overall carbon footprint of the delivery service. Parcel consolidation as a strategy can be implemented at many levels of the supply chain and at different scales. Recently, many retailers are now encouraging parcel consolidation by incentivizing orders to be shipped on the same day such as through the Amazon Day delivery program.
Microhubs are a strategy that establishes smaller fulfillment centers located within urban neighborhoods. This approach makes it easier for delivery to be made via cargo bikes and smaller electric vehicles, reducing the impacts noted above on curb space and quality of life in urban neighborhoods.