
Importance of Freight to Minnesota
Freight-related industries make up approximately 40% of all employment in Minnesota and directly or indirectly support many of the non-freight-related industries in the state. Each industry has unique needs and impacts on the state’s multimodal freight system.
Freight-related industries include, but are not limited to, manufacturing, warehousing and distribution, agriculture, food production and mining. Products and goods must be transported to the right place at the right time to drive Minnesota’s production-led economy. The multimodal freight transportation system is the platform that supports supply chains by facilitating the efficient, reliable and safe movement of freight.
Overview
Freight impacts all aspects of Minnesotan’s lives. From how and where we live and work, to what and how much we consume, freight plays a key role in the economic well-being and quality of life throughout the state. The dynamic nature of a market-led economy includes constant activity between sellers and buyers and frequent changes depending on cost, availability and quality of goods, transportation costs, seasonality, trends, technology, buyer behavior and other factors. Each freight mode is necessary to be cost-effective and meet the needs of customers specifically within those industries unique to Minnesota.
According to the U.S. Bureau of Labor Statistics, the labor force participation rate in Minnesota had been above 70% of all residents from October 1980 through to the summer of 2016, having reached a high of 76% in February of 2001. The labor rate was volatile through the pandemic period of the early 2020s, with the most recent levels at 68.5% in August 2023, well below pre-pandemic labor force participation rate levels. The relative lack of the working age population employed in the state’s economy has, in principle, limited the growth of the economy. While the state Gross Domestic Product (GDP) has rebounded, the economy could be more robust with more of the labor force actively participating as wage earners in the state’s economy. The percent of total employment by industry is shown in Table 1-1: Minnesota Employment by Industry Sector below. Though almost all industries are reliant on the movement of goods for supplies and equipment for their operations, those that are directly freight related account for over 40% of the employment in Minnesota.
Manufacturers, in particular, are vital to the economy in Greater Minnesota, not only in the community they operate in, but to the broader region. The urban and rural freight systems in Minnesota are highly interdependent and the success of both systems provides benefits to all Minnesotans.
Minnesota Freight Industries and the Economy
Freight industries are those that facilitate or are producers/consumers of freight, which is consistent with the Minnesota Statewide Freight System Investment Plan. The Minnesota industries that account for the largest share of freight trip production and/or attraction include:
- Agriculture, Forestry, Fishing and Hunting
- Mining, Quarrying and Oil and Gas Extraction
- Utilities
- Construction
- Manufacturing
- Wholesale Trade
- Retail Trade
- Transportation and Warehousing
Each of these industries have unique freight transportation needs and geographic footprint in terms of employment, market reach and impact to the state’s economy.
Following the approach used in previous freight plans, this plan effort reviewed each industry using a location quotient approach.
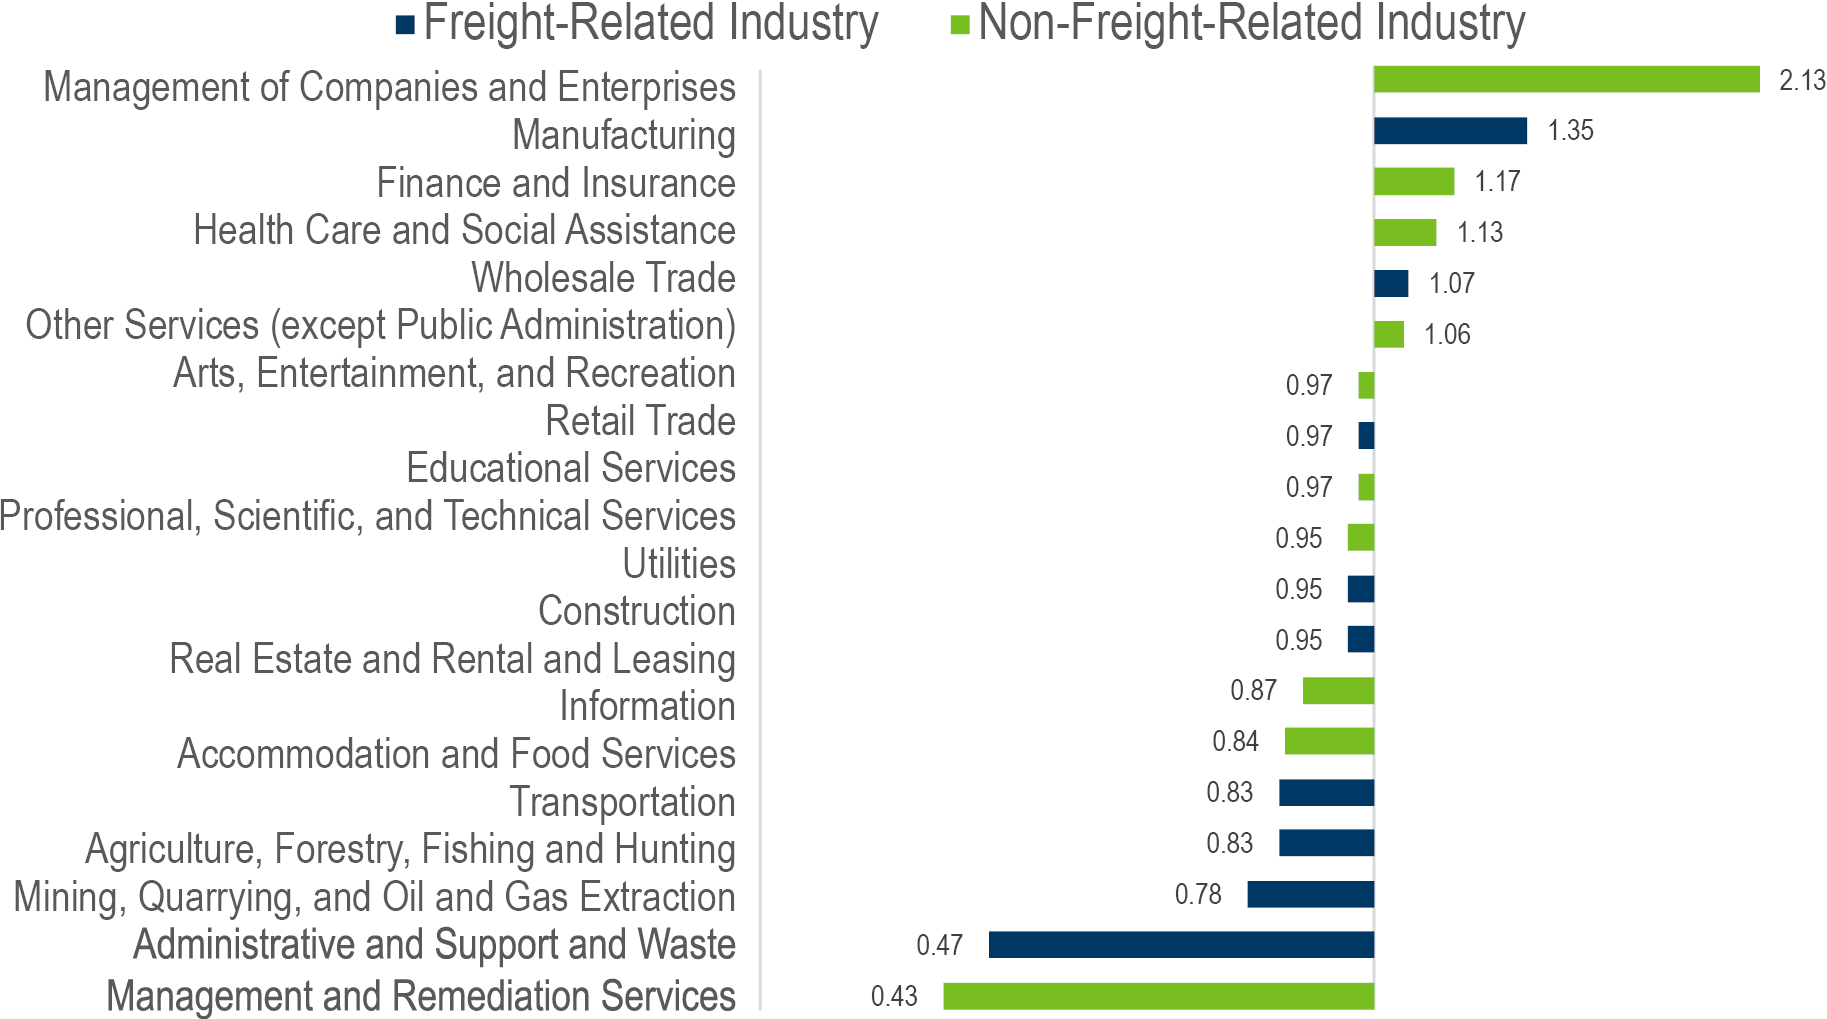
Under this method, the proportion of employment within each industry at the state level was compared to the proportion of that industry employment at the national level. This ratio—or location quotient—provides an indication of how specialized the state is within each industry. A location quotient value above 1.0 indicates a state is more specialized in that industry while a location quotient value below 1.0 indicates a state is less specialized in that industry.
The location quotient values for various industries in Minnesota are shown in Figure 1-1. For freight-related industries, Manufacturing is the most specialized at 1.35. Notably, while some industries show a low location quotient value at this level of aggregation, sub-industries within these categories often show differing results. For example, Mining, Quarrying and Oil and Gas Extraction shows the lowest location quotient at 0.47. However, the sub-industry of Metal Ore Mining results in a location quotient of 3.97, highlighting the extreme specialization of this industry in Minnesota.
Table 1-1: Minnesota Employment by Industry Sector
| Industry Sector | % of Total Employment | Directly Freight Related |
|---|---|---|
| Agriculture, forestry, fishing and hunting and mining | 2.2% | Yes |
| Construction | 6.4% | Yes |
| Wholesale trade | 2.6% | Yes |
| Retail trade | 11.0% | Yes |
| Transportation and Warehousing and Utilities | 5.0% | Yes |
| Manufacturing | 13.3% | Yes |
| Sub-Total: Freight-Related Industries | 40.5% | - |
| Information | 1.3% | - |
| Finance and insurance and real estate and rental and leasing | 7.2% | - |
| Professional, scientific, management and administrative and waste management services | 10.4% | - |
| Educational services and health care and social assistance | 25.7% | - |
| Arts, entertainment and recreation and accommodation and food services | 6.7% | - |
| Other services, except public administration | 4.4% | - |
| Public administration | 3.8% | - |
| Sub-Total: Non-Freight-Related Industries | 59.5% | - |
Figure 1-1: Minnesota Employment Location Quotients by Industry
Additional information regarding Minnesota’s freight industries can be found in Working Paper 4: Economic and Freight System Profile.
Agriculture, Forestry, Fishing and Hunting
There are over 3,100 commercial businesses in the state of Minnesota in the combined category of Agriculture, Forestry, Fishing and Hunting. There is broad, relatively even distribution of these enterprises throughout the state’s rural and urban areas, though fewer in the far north and eastern peninsula portions of the state.
The Minnesota agricultural economy generates substantial volumes of freight from across all counties, with row crops, hay, orchards, vegetables, livestock and other categories of sustainable production supporting food, fiber and fuel. The agricultural sector employs nearly 112,000 with a total market value of agricultural products sold of $18.4 billion. Primary farm sales revenues are from crops which generate $10.2 billion across the state annually, while $8.2 billion is generated from livestock, including products.
Nearly all agricultural products are delivered from the farm by truck, often by the producer themselves, but increasingly by a specialized hauler using grain trailers, able to drive throughout the year hauling production for numerous farmers to increase cost-effectiveness for agricultural producers and haulers alike.
The destinations for row crops are local, national and international. The commodities are transferred through local and regional grain elevators and transfer facilities, moved to processors for the production of products (meal, renewable biofuels, etc.) or shipped to major terminals for transloading to support exports. These crops are often moved by rail to the Pacific Northwest or barged via the Minnesota or Mississippi Rivers to Gulf ports and via truck/rail to the Port of Duluth-Superior on the Great Lakes.
Forestry and Logging is important to the state’s economy and is centered in Northeastern Minnesota. Of the total 17.7 million acres of forest in the state, there are approximately 160,150 acres that are harvested or thinned annually as of 2020. Of the state’s total land area, 34.7% is composed of forest according to data from the U.S. Department of the Interior, Forest Service Inventory and Analysis National Office database with less than 1% of the total being harvested.
Mining, Quarrying and Oil and Gas Extraction
Across the state of Minnesota, there are 189 verified businesses within the Mining, Quarrying and Oil and Gas Extraction sector. The locations are geographically dispersed throughout the state. However, revenue generation is centered on the Mesabi Range which is the primary location of the State’s iron mines. Minnesota is the leading producer of ferrous minerals, iron ore and taconite in the U.S. To support natural resource extraction, considerable investments have been made in workforce development, freight infrastructure and local support industries. Heavy haul, off-road vehicles transport the dense materials to rail and water modes.
Construction materials such as sand, gravel, crushed stone, kaolin clay, dimension stone, landscape stone and silica sand are transported across Minnesota via specialized truck operations, specific to the product mined. Surface mining operations occur in nearly every county in Minnesota and are used to create concrete and other construction materials.
Quarries of bedrock are the source of products such as crushed stone for use as aggregate in construction. Finer-grained kaolin clay is mined in and around the Minnesota River Valley and is used for cement production, tiles and bricks. Similarly, silica sand, a sand composed of fine quartz grains, is mined across Minnesota’s southeastern region for glass-making, as a source of silicon and for oil and gas well operations across the Upper Great Plains. Dimensional stone includes granite and quartzite, each of which is used in the construction of homes, buildings and monuments.
The Real GDP for the mining sector contributed $2.1 billion to Minnesota’s economy in 2021, excluding oil and gas.
Utilities
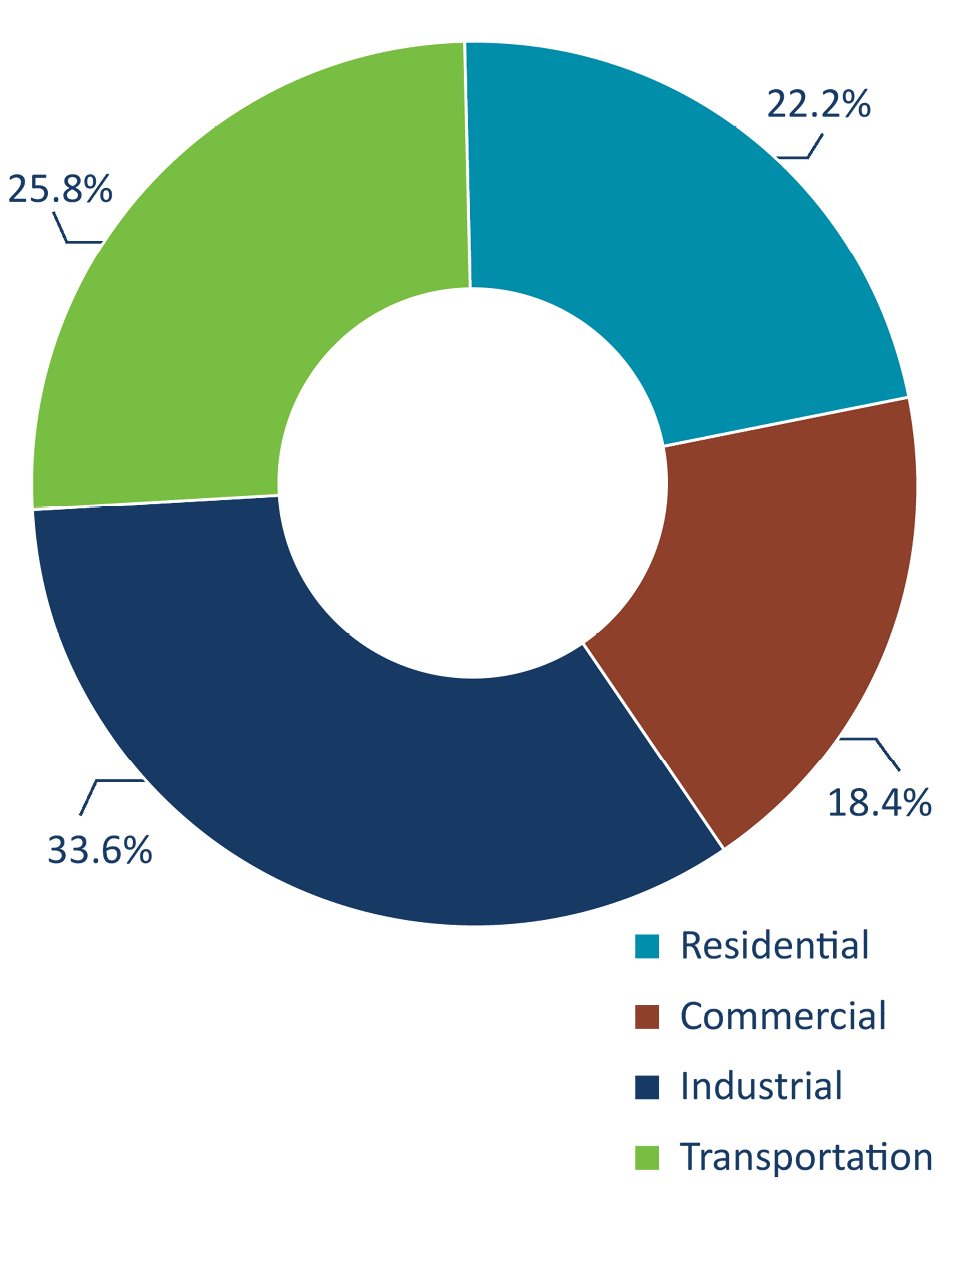
There are nearly 400 businesses in the Utilities industry in Minnesota. The utilities sector supports energy- intensive construction, food processing, chemical products manufacturing, petroleum refining, agriculture, mining and paper manufacturing industries. These seven industries accounted for one-third of Minnesota’s total energy use in 2021. The transportation sector consumed just over one- fourth of the state’s total energy which includes energy used by vehicles to transport people and goods and includes cars, trucks, trains, planes and boats. The state was the nation’s fifth- largest fuel ethanol producer, primarily for use in transportation, accounting for about 9% of U.S. total production, in 2021. Minnesota’s energy consumption by end-use sector is shown in Figure 1-2: Minnesota Energy Consumption by End-Use Sector (2021) below.
Utilities contribute $4.5 billion (2022) to the State’s economy largely due to the transition from coal plants to natural gas for electricity generation. In February 2023, Minnesota Senate Bill SF4 became law, establishing a Minnesota carbon-free electricity standard by 2040, resulting in the reduction in coal from 1.2 million tons to 0.8 million tons (July 2022 to July 2023) for electricity generation in Minnesota according to the Energy Information Agency (EIA).
The on-going reduction in coal use reduces the need for the transport of coal and minerals used for scrubbers within the utilities industry.
Figure 1-2: Minnesota Energy Consumption by End-Use Sector (2021)
Construction
The construction sector includes over 17,000 businesses within Minnesota as primary operators in the construction field, which are primarily located in more urbanized areas throughout the state. The construction industry requires a wide range of materials and finished products such as materials for residential, commercial and industrial facility construction (structural) and finishing (plumbing, electrical, flooring, fixtures etc.). In addition, the industry supports public and private infrastructure, including utilities, transport, communications networks and security apparatus to support the overall Minnesota economy.
Goods for the construction industry originate throughout Minnesota and the world. These include finished or semi-finished manufactured products such as concrete, lumber, steel, wire, pipe, paint, flooring, etc. The delivery of these materials is to warehouse/distribution facilities prior to retail stores and/or job sites.
Manufacturing
The Manufacturing sector is spread across Minnesota with over 9,300 businesses throughout the state, with a concentration of about 60% of these businesses located within the Twin Cities and surrounding Metro area counties.
According to the Minnesota Manufacturing Association (MMA) directory (2023), the leading manufacturing industries by total manufacturing employment are:
- Food and kindred products (15%)
- Industrial machinery and equipment (15%)
- Instruments and related products (10%)
- Printing and publishing (10%)
- Fabricated metal products (10%)
State manufactured exports reached $24 billion for 2022, up 12% over 2021. Service exports contributed about $12 billion the most recent year for which statistics are available at the level of the state’s economy (2019). USDA estimated that Minnesota exported $9.4 billion in agriculture and food products in 2021, ranking fourth in the nation. In 2021, exports of goods supported an estimated 117,900 jobs in Minnesota.
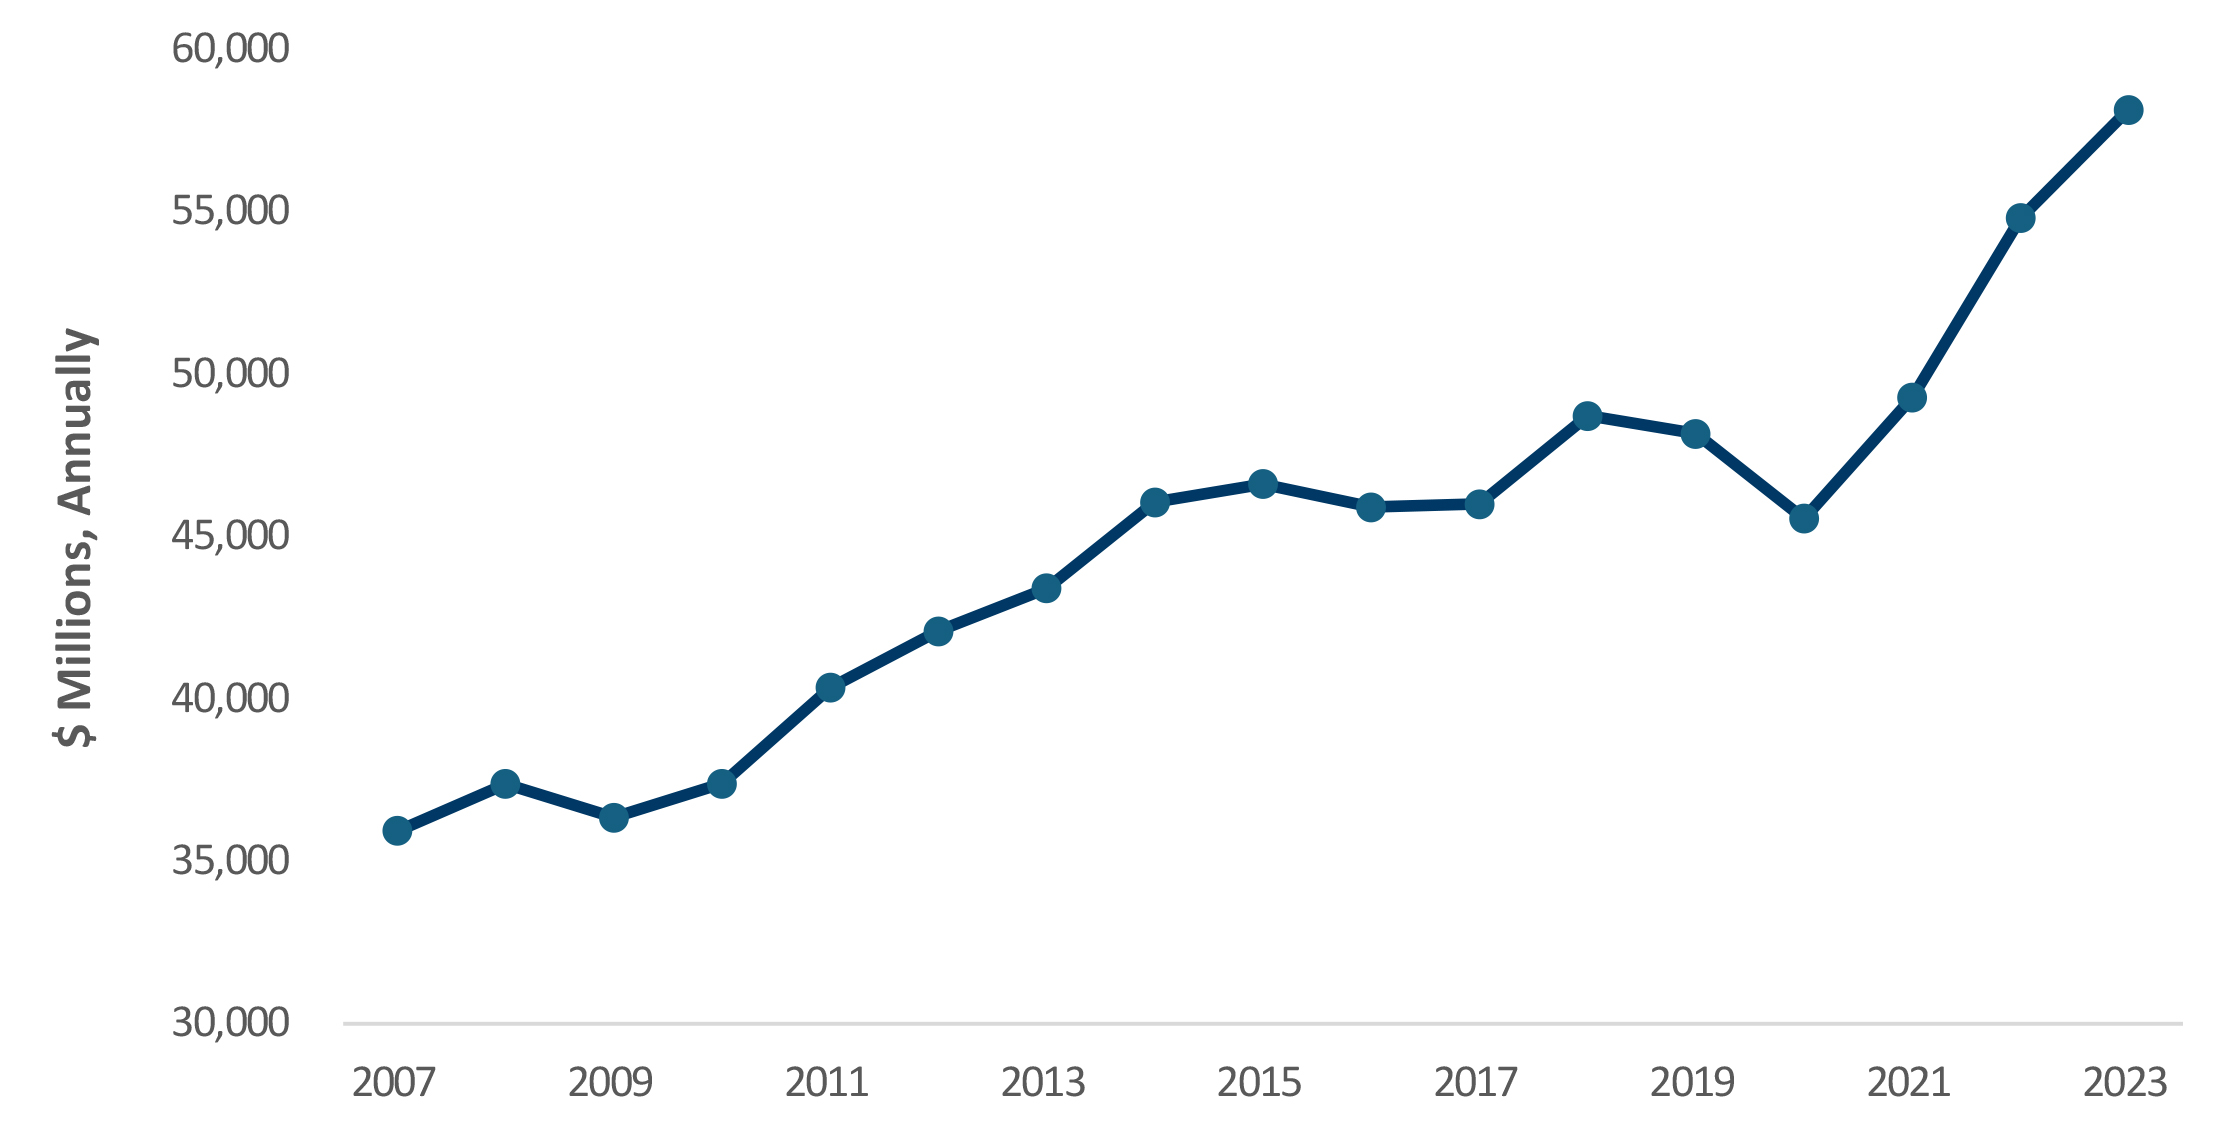
As shown in Figure 1-3, the Manufacturing sector contributed $57 billion to Minnesota’s state GDP in 2023. This represents a 27.6% increase from the $46 billion recorded in 2020 in the midst of the COVID 19 pandemic. In 2023, Minnesota’s Manufacturing industry accounted for 12% of the total state economy.
Figure 1-3: Minnesota Manufacturing GDP Contribution (2007-2023)
Wholesale Trade
Wholesale Trade is a substantial freight generating sector in Minnesota where there are a total of 17,930 businesses engaged in wholesale procurement and goods or materials acquisitions for downstream sales across many different markets.
Of the businesses with 20 employees or more and with revenues of $2.5 million or greater, Medical Dental and Hospital Equipment and Supplies leads the category, followed by Packaged Frozen Food Merchant Wholesalers, demonstrating that these businesses tend to be of somewhat larger scale, both in terms of number of employees and in value of sales volumes.
There are nine businesses in Wholesale Trade based in Minnesota whose revenues exceed $1 billion, with another 19 businesses having revenues between $500 million and $1 billion. On the next page, Table 1-2: Minnesota Top Wholesale Trade Industry Companies by Revenue summarizes the largest businesses within the Wholesale Trade industry in Minnesota.
Table 1-2: Minnesota Top Wholesale Trade Industry Companies by Revenue
| Businesses | Location | Employees | Annual Revenue | Details |
|---|---|---|---|---|
| General Mills | Golden Valley | 34,000 | $17.6 billion | Food processing |
| Ferrellgas | Buffalo | 4,000 | $2.0 billion | National supply network for propane and natural gases. |
| Digi-Key Electronics | Thief River Falls, Pennington County | 3,000 | $1.8 billion | Online sales of electronic components, equipment and appliances |
| Bluestem Brands (Fingerhut) | Eden Prairie | 1,900 | $1 billion | Retail and wholesale distribution. |
| Emerson Performance Solutions | Eden Prairie | 1,500 | $1.4 billion | Provides systems control units and regulators. |
| Quality Pork Processors | Austin, Mower County | 1,500 | $1.35 billion | Fresh pork production |
| Boise White Paper | International Falls | 850 | $1.4 billion | Subsidiary of Packaging Corporation of America (PCA) |
| Manheim Minneapolis | Maple Grove | 400 | $1.4 billion | Wholesale automobile distribution |
Minnesota Department of Employment and Economic Development. Minnesota Export Statistics. 2023
Retail Trade
With nearly 28,500 businesses in Minnesota in retail trade, the dramatic increase in e-commerce has changed the retail landscape and freight reliance across the state. Historically, retail businesses have been located proximal to population centers, commonly clustered, in shopping districts designated by zoning and facilitated through real estate development. Shopping centers and malls often require shipments from wholesalers and parcel companies by truck curbside or via loading docks for larger establishments. While the number of businesses in retail is dispersed across the state, the number of employees is concentrated in the Twin Cities.
In addition to those businesses whose primary business is retail trade, there are nearly 40,500 enterprises across the state that are involved in retail sales. This may include small businesses that make products and might have a small shop where they are sold.
Data found that 40% of these businesses employ five or fewer workers and nearly 33% have revenue of under $1 million. These small retail establishments generate inventory turnover, have procurement operations with deliveries to their business locations and generate customer trips and parcel freight pick- ups and drop-offs.
The products within the retail category range widely, from Peterbilt heavy trucks to common automobile dealerships, home appliance stores, department stores, grocers, etc. The number of cities with these larger retailers are generally concentrated within population centers throughout the state.
Transportation and Warehousing
Companies within the Transportation and Warehousing industry account for over 37% of Minnesota’s GDP with nearly 5,700 companies in the state. This includes a range of services such as taxicabs, services, courier and expedited delivery, freight scales, industrial storage and trucking companies. Around 8,400 Minnesota companies have either primary or some secondary involvement transport and warehousing.
According to Minnesota Department of Employment and Economic Development (DEED) the number of Laborers and Freight, Stock and Material Movers are estimated to increase 6.5% from 2020 to 2030. Heavy and Tractor Trailer Truck Drivers are projected to rise 4.1% over the period, Dispatchers within the trucking industry are expected to increase 2.2% and Industrial Truck and Tractor Operators (generally referred to as ‘forklift operators’) are expected to rise in Minnesota 4%. Shipping, Receiving and Inventory Clerks are forecasted to decrease over the decade 6.6%, due to the increase in automation within the industry.
Logisticians are specialists in demand planning, supply planning, sales and operations who work to strike the balance between production and consumption, to minimize waste, excess, or inefficiencies throughout the goods movement processes. Logisticians are responsible for the entire life cycle of a product, including acquisition, distribution, internal allocation, delivery, along with final disposal of resources or returns from customers or transport service providers. These positions are expected to increase 29% by 2030.
Cargo and Freight Agents employment in the Minneapolis-St. Paul, Minnesota region is ninth in the country among major Business Economic Areas and arrange freight locally as well as imports and exports, within and outside the U.S. According to DEED 2020 data, employment in this area is expected to grow 6.5% between 2020 and 2030.
Transportation, Storage and Distribution Managers are expected to rise 4% between 2020 and 2030 and are responsible for making management decisions specific to the transport of goods.
International Trade
Previous decades have seen a steady advancement in the extent and complexity of the integration of the global supply chain. Trade policies enacted by the U.S. and other nations over a period of more than half a century reduced price controls, deregulated capital markets and lowered trade barriers and also increasingly intertwined the world’s capital goods markets and supply chains. Driven by labor and market incentives, components of finished products, materials and finished goods frequently cross borders and large geographic distances numerous times before reaching a final consumer.
Because the state ships and receives freight to and from locations around the world, Minnesota’s globally competitive economic and trade practices are significantly impacted by international trade policies. Minnesota’s freight system engages in international trade by a range of modes, including motor carrier, rail, maritime, air and pipeline.
As Minnesota’s economy, distribution chains and logistics networks continue to mesh with the global supply chain system with increasingly layered complexity, the state will continue to optimally position its industries to meet emerging opportunities and challenges One method Minnesota used to better understand the challenges facing industries in the state was the Manufacturers’ Perspectives Studies. This series of studies, conducted at a District level for all eight MnDOT districts, included hundreds of interviews with manufacturers and freight carriers with the purpose of understanding the unique challenges faced by these businesses and identifying freight system improvements that could help to address these challenges.
Minnesota conducted approximately $70 billion in total trade with 215 countries in 2022, an increase of approximately 21% over 2021. With nearly $43 billion in imports (up 31% over 2021), the state’s 2022 trade deficit was about $15 billion. The state’s top international exports categories included Medical and Optic products, Machinery, Electrical Equipment, Mineral Fuel and Oil, Vehicles and Plastics. International exports of Minnesota’s cereal product was particularly strong, with an increase of 138% over 2021.
Minnesota’s strongest international trade partner is Canada, with which Minnesota shares a 547-mile border including the provinces of Manitoba and Ontario. The major truck border crossings between Minnesota and Canada are at International Falls, Grand Portage, Baudette and Warroad. In 2022, Minnesota exported $8.9 billion in exports to Canada, $2.8 billion to Mexico, $2.6 billion to China and $1.1 billion to Japan.
Minnesota also maintains access to international markets via three ports on Lake Superior with access to the St. Lawrence Seaway and four ports on the Mississippi River system. These ports and their associated intermodal infrastructure provide essential transportation connections and access to national and international markets. The Mississippi River provides access to river ports to the south and the Gulf of Mexico via New Orleans; the Great Lakes- St. Lawrence Seaway provides access to other ports along the Great Lakes to the Atlantic Ocean. Additionally, each of the Class I railroads serving Minnesota also provides access to international markets either through border crossings into Canada and Mexico and via connections with coastal ports.
MnDOT Coordination with Local Governments
MnDOT is responsible for the maintenance of the state transportation system including all Interstate highways, U.S. highways, and the state’s trunk highway system. Oversight of freight and freight issues on local road systems is handled through coordination between MnDOT’s eight districts and the local roadway authorities (e.g., counties, cities and townships).
Truck Size and Weight
One issue frequently cited by the public and other stakeholders is the impact of larger freight vehicles on the local roadway system. MnDOT does not have the jurisdictional authority to regulate truck traffic on these local road systems but can coordinate with the local roadway authorities on potential actions and strategies.
MnDOT currently has no plans to modify the existing truck size and weight restrictions on the state highway system. However, MnDOT and the University of Minnesota are currently researching the impacts of truck size and weight on local roads.