
Chapter 5
How will we guide ourselves moving forward
The challenges Minnesota is facing require bold, coordinated approaches. This work cannot be left to chance. Collective commitment is needed from all with a role in making transportation work for Minnesotans. The policy direction in this SMTP is an invitation to join MnDOT to build this bold new transportation future together.
Read Chapter 5 to:
- Understand the policy direction that will guide transportation decisions for the next 20 years:
- Objectives - desired outcomes meeting the Minnesota GO Vision and transportation goals.
- Performance Measures - metrics used to track progress toward the success of the objective.
- Strategies and Actions - approaches and specific steps to meet or support the objective.
Objectives, performance measures, strategies & actions
The purpose of this plan is not to list every possible activity, but to focus on key areas where additional emphasis is needed. Taken together, the objectives, performance measures, strategies and actions support the Minnesota GO Vision and 16 statutory goals for transportation in Minnesota. The plan focuses on six objectives:
- Transportation Safety
- System Stewardship
- Climate Action
- Critical Connections
- Healthy Equitable Communities
- Open Decision Making
-
Each objective has four parts:
Objective statement – desired outcomes for meeting the Minnesota GO Vision and transportation goals. - What this is about – description about the purpose of the objective.
- Performance measures – metrics used to track progress toward the success of the objective.
- Strategies and actions – approaches and specific steps to meet or support the objective.
The objectives, performance measures, strategies and actions are listed in no particular order.
To help ensure that progress is made over the next 20 years, each objective includes a list of related performance measures. These measures help track progress toward meeting the objectives and the desired outcomes of the vision. The state performance measures are a mix of metrics MnDOT has authority over and some MnDOT does not. Some of the measures influence annual decision-making processes. Other measures help to understand how the transportation system is functioning over time but are beyond any one agency to directly influence. To clarify the difference between the performance measures, the tables below include a column titled “MnDOT’s Role.” The agency’s role may be a mix of Lead, Partner and Support reflecting the following considerations:
- Lead: MnDOT has authority to influence the measurable outcomes that help meet SMTP objectives.
- Partner: MnDOT collaborates with key partners to measure system performance over time.
- Support: MnDOT has limited direct authority and focus may be on long-term outcomes.
Land use and development affect how, when and why people travel. Land development is primarily managed by local governments such as cities, counties and townships. Transportation agencies like MnDOT typically do not have a leading role in land use decisions. Transportation decisions also can affect where and how land is used and developed. Local planning discussions need to start with the acknowledgment that land use and transportation decisions affect each other. Priorities and community needs will vary throughout the state. Land use decisions and transportation design and operations should reflect those differences.
Transportation Safety
Safeguard transportation users as well as the communities the system travels through. Apply proven strategies to reduce fatalities and serious injuries for all modes. Foster a culture of transportation safety in Minnesota.
WHAT THIS IS ABOUT
Ensuring transportation safety is a top priority for Minnesota. It includes the safety of people traveling and the safety of the communities the system travels through.
Ensuring transportation user safety applies to all people who use the transportation system regardless of their mode of travel, as well as transportation workers. Comprehensive safety involves an integrated approach that includes education, enforcement, engineering and emergency medical and trauma services – and more. Each of these areas is critical to improving overall safety and helping to grow a safe transportation culture in Minnesota.
Advancing transportation equity in safety is key to making sure all Minnesotans are safe. A one-size-fits-all approach does not work for transportation safety. Data can help MnDOT and transportation partners understand how to address specific safety challenges and eliminate the disproportionate number of fatalities and serious injuries for people who are underserved by transportation, especially BIPOC. Working with communities to make transportation decisions grounded in local wisdom can help eliminate disparate safety outcomes.
Protecting community safety is much more than just transportation. There are risks to the transportation system that can negatively impact community safety by impeding essential travel needs such as emergency response, emergency medical and trauma services. These threats include severe weather, acts of terrorism and crime. Planned special events like major sporting events, parades and marathons can also strain or overwhelm the transportation system’s capacity and inhibit public safety efforts. In addition, transportation infrastructure, facilities and services can impose risks to surrounding communities.
Through the Toward Zero Deaths program, MnDOT partners with various enforcement agencies (state and local) that improve road user safety through education and enforcement. MnDOT encourages a holistic and collaborative approach to ensure enforcement that does not adversely impact BIPOC and other underserved communities. To advance equity in transportation, each organization has a specific role to play to ensure people and communities are safe.
Reducing fatalities and serious injuries requires an ongoing focus that puts safety first and helps demonstrate Minnesota’s commitment to protecting people traveling. Understanding and accommodating human behavior can reduce fatal and serious injuries. Implementing “Safe System” designs can improve safety for all people traveling by any mode. See the call out box to learn more about the Safe System approach to transportation safety.
Building a culture of safety requires ongoing collaboration to recognize and reduce gaps in transportation safety. A mix of traditional and innovative practices and methodologies will likely be required to prevent and mitigate crashes and injuries. Partners—like those in engineering, enforcement, education and emergency response—can help shift the focus upstream to design and operate a safe transportation system for all Minnesotans especially those most vulnerable. Everyone has a role and responsibility to implement an equitable, Safe System approach.
-
Safe System Approach
Safe System approach to traffic safety makes a commitment to reach zero deaths through building a culture of safety. The six principles of Safe System address all aspects of transportation safety through a people-centered, holistic approach. Road system investment decisions are central to a culture of safety putting MnDOT and transportation partners in a key position to achieve our zero deaths vision.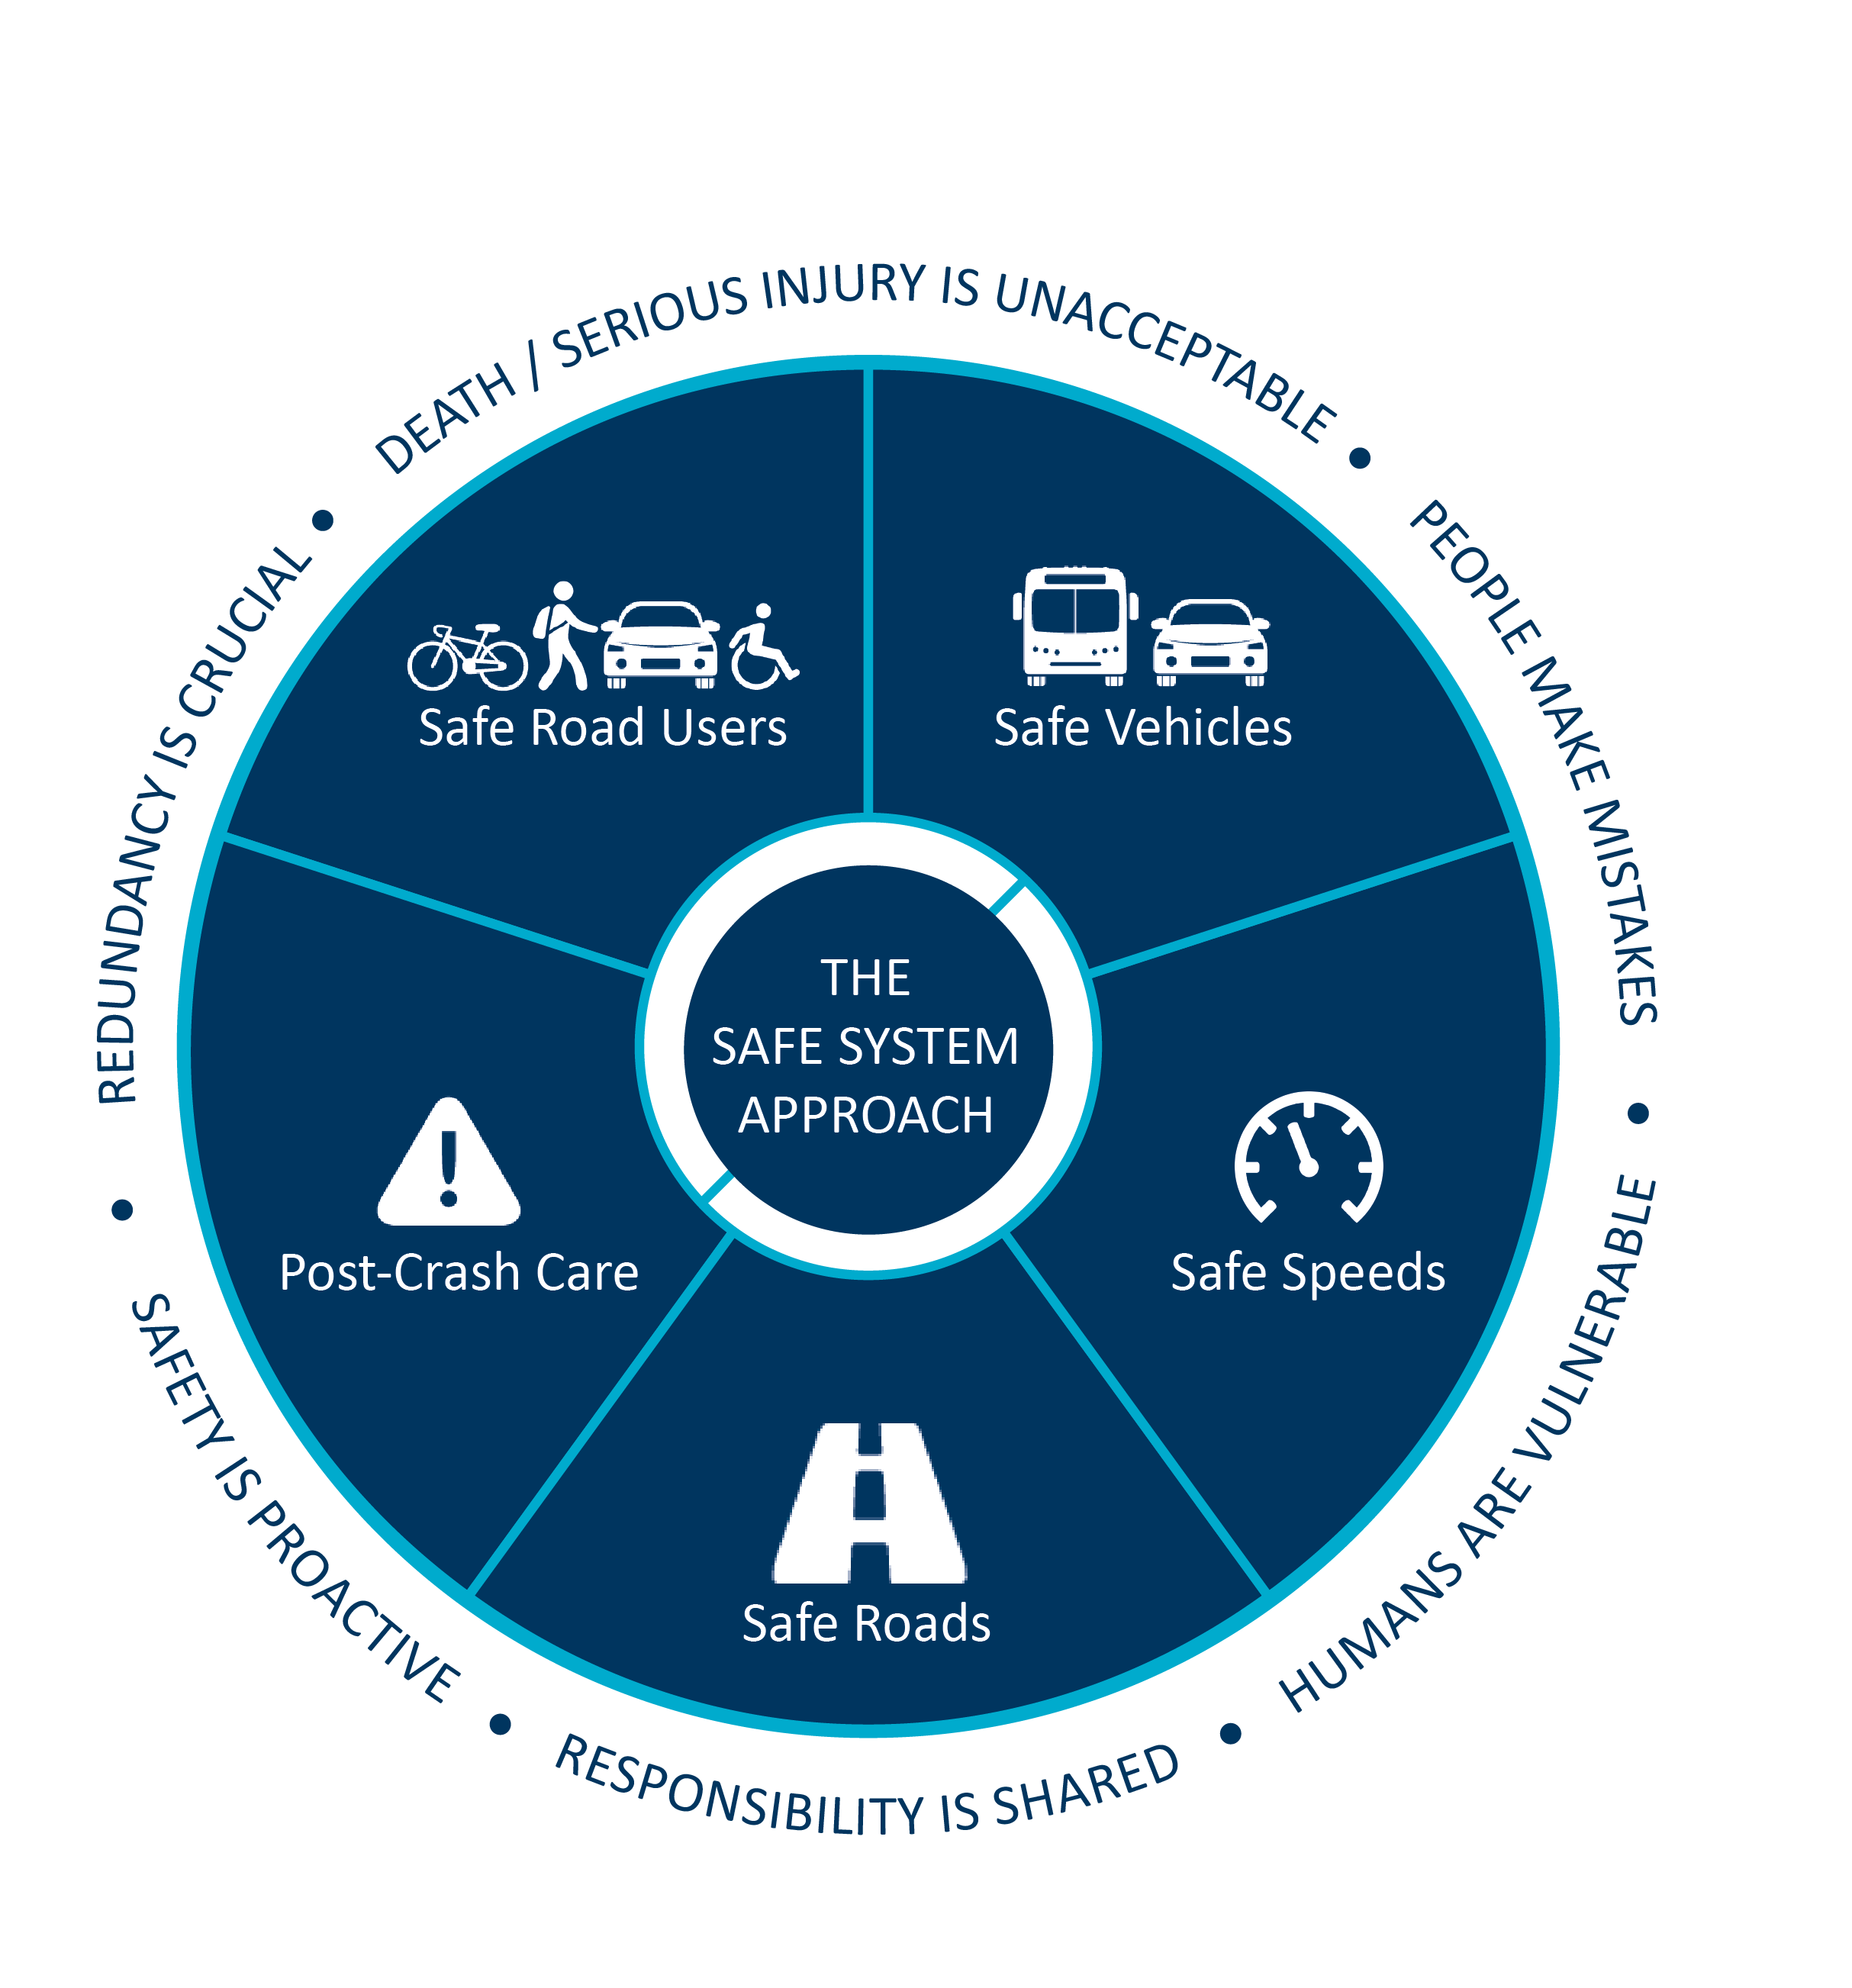
- MnDOT’s transportation safety partnerships like Minnesota Toward Zero Deaths (TZD) and Safe Routes to School are key to building a culture of safety through a Safe System approach. TZD is the state’s cornerstone traffic safety program, employing an interdisciplinary approach to reducing traffic crashes, injuries and deaths on Minnesota roads. Safe Routes to School improve safety, reduce traffic and improve air quality near schools through a multidisciplinary approach. Everyone has a role in a culture of transportation safety!
PERFORMANCE MEASURES
Table 5-1 lists performance measures related to the Transportation Safety objective. More information on these performance measures can be found in Appendix I – Performance Measures.
TABLE 5-1: TRANSPORTATION SAFETY PERFORMANCE MEASURES
| Measure | Description | Current Condition | Target or Desired Direction | MnDOT’s Role | Reporting |
| Fatalities | Annual traffic fatalities on Minnesota roadways | 488 traffic fatalities (2021) | ≤225 by 2025 | Lead & Partner | Number and trend |
| Serious Injuries | Annual traffic serious injuries on Minnesota roadways | 1,722 serious injuries (2021) | ≤980 by 2025 | Lead & Partner | Number and trend |
| Pedestrian Fatalities and Serious Injuries | Annual fatalities and serious injuries of people walking on Minnesota roadways | 55 pedestrians killed and 168 seriously injured (2021) | Decreasing to 0 | Lead & Partner | Number and trend |
| Bicycle Fatalities and Serious Injuries | Annual fatalities and serious injuries of people bicycling on Minnesota roadways | Nine bicyclists killed and 52 seriously injured (2021) | Decreasing to 0 | Lead & Partner | Number and trend |
| Perception of Safe Walking and Bicycling | Percent of MnDOT Omnibus Survey respondents perceiving safe environments for walking/bicycling | 84% of respondents felt safe bicycling 78% of respondents felt safe walking (2020) | ≥80% overall and for each demographic segment | Partner | Percent and trend; report by different demographic segments |
| Aviation Fatalities and Crashes | Total number of aviation fatalities and incidents | Four fatalities in four crashes (2021) | 0 | Partner | Number and trend |
| Rail Derailments | Annual total number of rail derailments | 18 (2020) | 0 | Partner | Number and trend |
| Rail Grade Crossing Fatalities and Serious Injury Crashes | Annual number of crashes at highway-rail grade crossings that result in a fatality or serious injury | 4 fatalities and 11 serious injuries (2021) | 0 | Lead & Partner | Number and trend |
| Rail Grade Crossings | Annual percent of highest risk crossings receiving improvements | Under Redevelopment | ≥5% annually | Lead & Partner | Percent and trend |
| Incident Clearing Time | Average incident clearance time | ≤35 minutes since 2010 | ≤35 minutes | Lead | Number and trend |
| Transit Safety Events | Urban transit operators (i.e., 5307) safety events | In development | Decreasing number of events | Partner | Under consideration through SMTP Work Plan |
Other related performance measures include: Bridge Inspections (System Stewardship), Rest Area Condition (System Stewardship) and Rural Transit Vehicle Condition (System Stewardship).
“We have very few sidewalks to walk on so walkers have to walk on the shoulder of the streets. Vehicles don't move over when meeting a walker and I've even had vehicles swerve towards me when I have been walking in the street because there is no sidewalk.” - Comment shared during SMTP engagement
STRATEGIES & ACTIONS
- Coordinate with partners to ensure the health, safety and security for people most vulnerable especially for those walking, rolling, bicycling and taking transit.
- Implement more forgiving road design to mitigate the severity of crashes and the resulting injuries.
- Work with partners to create and implement shared values, actions and behaviors that build a traffic safety culture for all modes.
- Leverage partnerships to implement Toward Zero Deaths and Vision Zero strategies and road safety design initiatives.
- Implement best practices for people to feel safe and secure walking, rolling, bicycling and taking transit.
- Develop effective engagement efforts to educate local agencies and the general public on engineering solutions that will improve safety.
- Modify infrastructure to accommodate all modes of transportation using complete streets, context sensitive and Safe System approaches.
- Explore opportunities for lower cost solutions that can be deployed quickly.
- Design roads for appropriate speeds based on land use context and user needs.
- Design and maintain transportation infrastructure to support current and new technology with proven safety benefits for all users.
- Emphasize equitable education and enforcement techniques with proven safety benefits for people and communities.
- Support effective education and enforcement efforts focused on unsafe transportation behaviors such as speeding, not using seatbelts, distracted driving, driving under the influence, etc.
- Engage communities in an ongoing dialogue on transportation safety needs for all people and modes.
- Collaborate with other agencies like the Department of Public Safety to explore equitable enforcement approaches through research and review of new and best practices.
- Expand collecting and sharing of transportation safety data to include factors most important to underserved populations.
- Develop and share critical safety information and support education and outreach efforts to improve health, safety and security for people.
- Prioritize safety for people and communities through the safe movement of goods.
- Invest to increase safe and reliable routing for hazardous, oversize and overweight material transport.
- Increase availability and accessibility of safe and reliable freight truck parking.
- Invest in safety improvements to roads, sidewalks, bicycle lanes and trails that cross railroads and freight routes, including the installation of gates and warning signs.
- Collaborate with local, regional, Tribal, state and federal partners to ensure efficient and coordinated response to special, emergency and disaster events.
- Work with emergency medical and trauma services to reduce response time and increase survivability.
- Enhance and maintain emergency communications infrastructure across the state.
- Preserve and enhance critical access routes for emergency response.
- Develop emergency response plans in areas where evacuation or other major events may require coordinated transportation responses.
- Promote the development and deployment of connected and automated transportation technologies.
- Pilot technologies and business models to maintain flexibility in a changing market.
- Use technology to improve transportation accessibility and safety for all Minnesotans and to reduce transportation disparities.
- Improve school and work zone safety by leveraging connected and automated vehicle technologies and data.
- Advance connected and automated vehicle research and data collection to address Minnesota’s transportation challenges and opportunities.
System Stewardship
Strategically build, maintain, operate and adapt the transportation system based on data, performance and community needs. Ensure effective and efficient use of resources.
WHAT THIS IS ABOUT
MnDOT and transportation partners are stewards of the transportation system. This includes the management of specific transportation assets and the overall transportation system. Ensuring the transportation system stays in a state of good repair is a key goal. With a changing climate and other disruptive events, there is also a focus on resiliency of the transportation system. Each of these components plays a key role in ensuring the transportation network is reliable.
Managing assets is a systematic process of cost-effectively operating, maintaining and upgrading assets once they are built or purchased. Transportation assets include all aspects of the transportation system such as travel ways, vehicles and support facilities. This also includes data, software and research that help improve materials and practices to maximize the useful life of an asset. The trend for the past decade has been to focus on maintaining and modernizing existing roads and bridges, while strategically completing the network for other modes. This continues to be a priority.
Designing with context sensitivity ensures that the character of projects is appropriate to the surrounding context, such as built, natural and cultural elements. Developing accessible transportation facilities with the community in mind can create transportation projects that reflect the goals of the people who live, work and travel in the area. Context varies by geography, community and how someone uses the system. A community-based approach to transportation requires partnering early and often, understanding the needs of all users and considering impacts that extend beyond the right-of-way.
Practicing environmental stewardship protects and improves natural and cultural resources. This includes focusing on equity, the environment and our economy while also planning for the near- and long-term stewardship of environmental resources. MnDOT and transportation partners can consider new environmental quality techniques, maintenance activities and alternative site design practices to preserve the state’s natural and cultural resources while reducing harm.
Developing the transportation workforce can provide opportunities to leverage innovation and technology. Innovation is critical to get the most out of transportation investments. By seeking a diverse workforce and promoting transportation careers, MnDOT and transportation partners can identify more efficient ways to build, maintain and adapt to ongoing system-level changes (e.g., climate change).
PERFORMANCE MEASURES
Table 5-2 lists performance measures related to the System Stewardship objective. More information on these performance measures can be found in Appendix I – Performance Measures.
TABLE 5-2: SYSTEM STEWARDSHIP PERFORMANCE MEASURES
| Measure | Description | Current Condition | Target or Desired Direction | MnDOT’s Role | Reporting |
| Pavement Condition | Annual percent of state highways with good and poor ride quality |
|
| Lead | Percent, trend and predicted future |
| Bridge Condition | Annual percent of state bridges in good and poor condition as a percent of total bridge deck area |
|
| Lead | Percent, trend and predicted future |
| Bridge Inspections | Annual percent of routine bridge inspections completed on time | 99.9% (2021) | 100% | Lead | Percent and trend |
| Culvert Condition | Annual percent of highway culverts in poor or severe condition | 18% (2021) | ≤10% | Lead | Percent and trend |
| ADA Compliance | Total percent of state-owned sidewalks, signals and curbs substantially compliant with ADA standards |
| 100% by 2037 | Lead | Percent and trend |
| Airport Pavement Condition | Measure identifying the condition and quality of the airport infrastructure across the state | Under Redevelopment | ≤4% | Lead & Partner | Percent and trend |
| Rural Transit Vehicle Condition | Percent of 5311 vehicles exceeding Useful Life Benchmark (ULB) | 7.5% (2020) | <10% | Partner | Percent and trend |
| Rest Area Condition | Share of buildings in poor condition | 8% (2021) | <4% | Lead | Percent and trend |
| Native Seeding and Plantings | Percentage of acres planted with native seeds and plants as part of large projects | Seeding: 61% (2020) Planting: 50% of projects planted with native plantings (2021) | Seeding: ≥75% | Lead | Percent and trend |
| Road Salt Chloride Use | Rate of liquid to solid de-icing chemicals applied to reduce overall chlorides used on the roadway for snow and ice control | 41 gallons of liquid chlorides used for every ton of salt (2020-2021) | 200 gal of liquid per ton of solid by 2027 | Lead | Rate and trend |
| Workforce Participation | Annual percent ethnic representation and women in the highway-heavy construction workforce | 12.9% of people working on a federal aid highway project were ethnic representation and 11.1% were women (July 2021) | Increasing | Partner | Percent and trend |
| Representation within MnDOT | Annual percent racial and ethnic representation and women in MnDOT’s workforce | 11% ethnic representation and 22% women in MNDOT’s workforce | Increasing | Lead | Percent and trend |
Other related performance measures include: Rail Grade Crossings (Transportation Safety), Greenhouse Gas Emissions (Climate Action) and Resilience (Climate Action).
“Undeniably, funding for maintenance and preservation activities needs to be consistent and sustainable.” - Comment shared during SMTP engagement
STRATEGIES & ACTIONS
- Maximize the useful life of transportation assets while considering performance, costs and impacts to people, the environment and our economy.
- Incorporate asset management principles in capital, maintenance and operations decisions.
- Ensure capital planning processes cover preventive maintenance.
- Review planned maintenance and reconstruction projects to identify cost-effective opportunities to improve safety, manage congestion and improve transportation options.
- Minimize environmental impacts and lower lifecycle costs through the reuse of materials and use of innovative new materials and techniques.
- Use performance-based planning and data to inform the location and timing for project improvements.
- Improve coordination with partners on the management of all assets connected to the transportation system.
- Expand fiber optic and communications infrastructure for safety, access and operational benefits.
- Explore contractual, technical and design options for better year-round maintenance and use for all modes of transportation.
- Align timing and scale of transportation improvements with local utility replacement plans.
- Plan, design, develop and maintain transportation infrastructure and facilities in a way that reflects and is informed by the surrounding context.
- Make transportation improvements that support existing and compatible planned land uses.
- Right size the transportation system to make the best use of available resources and right-of-way for all modal options.
- Expand opportunities to leverage full value and productivity of existing transportation right-of-way.
- Develop a transportation system that is respectful of cultural resources and maintains those resources for generations to come.
- Preserve and improve Minnesota’s natural resources and minimize harm to the environment.
- Promote pollinator habitat, native plantings and trees within transportation right-of-way.
- Integrate green infrastructure practices into transportation projects and facilities.
- Improve water quality through the development and use of innovative stormwater management strategies.
- Implement practices that reduce chloride use during winter maintenance.
- Research, develop and implement measures to preserve habitats near the transportation system, protect wildlife and limit the spread of invasive species.
- Provide training and resources for a diverse and inclusive transportation workforce.
- Examine current hiring practices and policies to reduce biases.
- Identify opportunities to attract, retain, develop and promote Black, Indigenous and People of Color, people with disabilities, women and people from other underserved communities.
- Set and meet equity goals in awarding contracts and build community capacity to fulfill contracting goals.
- Analyze and reduce barriers to contracting such as project size, performance bonding, insurance requirements and capital access.
- Provide consistent equity messaging and training opportunities in the transportation sector.
- Promote transportation trades and technical careers.
- Promote careers in transportation including job fairs, partnering with schools and other activities.
- Support organizations to create a diverse pipeline of qualified applicants for construction and transportation operations.
- Work with partners to develop training and apprenticeship programs in transportation-related occupations with high demand.
- Create new partnerships to expand recruitment efforts that address transportation needs and the pool of bus, commercial and volunteer drivers.
Climate Action
Advance a sustainable and resilient transportation system. Enhance transportation options and technology to reduce greenhouse gas emissions. Adapt Minnesota’s transportation system to a changing climate.
WHAT THIS IS ABOUT
Minnesota's climate is changing and will continue to do so for the foreseeable future. The decades ahead will bring even warmer winters and nights and heavier rainfalls. This includes the likelihood of increased summer heat and the potential for longer dry spells. Minnesota is also likely to see more severe weather and floods. For these reasons, climate change will impact the way transportation infrastructure is used, built, operated and maintained. Change is needed to ensure the transportation system can sustain through and adapt to climate change. Key commitments include reducing emissions, coordinating with communities and building resiliency.
Enhancing transportation options to provide a variety of choices for people to access goods, services and destinations is key. Transportation partners must work together to make transportation accessible, equitable and reliable, which can encourage shifts to lower emission transportation options.
Reducing emissions from the transportation sector will create healthier and more livable communities. Minnesota’s transportation sector is the largest contributor to greenhouse gas emissions—the most significant cause of climate change–in the state. This objective focuses on tailpipe emissions as this presents a significant near-term opportunity to curb GHG emissions. Lower emissions modes of travel (such as walking, rolling, bicycling and taking transit), electric vehicles, alternative fuels and innovative technologies and solutions can help reduce GHG emissions.
Coordinating with communities is key to understanding people’s needs. Resilient and sustainable solutions need to be centered on community voices, especially underserved communities who are facing severe climate change impacts. It is crucial that coordination and consultation with impacted communities occurs early and often, so the community can be a partner in creating effective, sustainable and adaptive solutions that work for them.
Building resiliency within the transportation sector can help communities recover from a range of events. Within transportation and infrastructure planning, there are two types of climate change responses—mitigation and adaptation. Mitigation focuses on reducing emissions to slow climate change. Reducing GHG emissions results in healthier communities, enhanced biodiversity and a stronger economy. Adaptation focuses on adjusting to the effects of climate change that are already happening and cannot be avoided. Adaptation can reduce vulnerability and increase resilience through asset management, long-range planning, design, construction, operations and maintenance.
PERFORMANCE MEASURES
Table 5-3 lists performance measures related to the Climate Action objective. More information on these performance measures can be found in Appendix I – Performance Measures.
TABLE 5-3: CLIMATE ACTION PERFORMANCE MEASURES
| Measure | Description | Current Condition | Target or Desired Direction | MnDOT’s Role | Reporting |
| Greenhouse Gas Emissions | Total annual greenhouse gas emissions from the transportation sector (percentages shown in parenthesis reflect percent reduction from 2005) | 40.3 million metric tons CO2e (2018) |
| Lead & Partner | Number and trend |
| Zero Emission Vehicles (ZEV) Registered in Minnesota | Percent of all light-duty vehicles registered in Minnesota that are electric or another type of ZEV | 23,897 EVs registered 0.4% of total vehicles (December 2021) |
| Support | Percentage and trend |
| Zero Emission Vehicles (ZEV) Sold in Minnesota | Percent of new light-duty vehicles registered in Minnesota that are electric or another type of ZEV | About 2% (2021) |
| Support | Percentage and trend |
| System Resilience | Measure that evaluates resilience at a system level (i.e., not just individual assets) | In development | Work plan item | Lead | Under consideration through SMTP Work Plan |
| Asset Resilience | Resilience of assets by type (e.g., bridges, culverts, etc.) | In development | Work plan item | Lead | Under consideration through SMTP Work Plan |
Other related performance measures include: Perceptions of Safe Walking and Bicycling (Transportation Safety), Vehicle Miles Traveled (Critical Connections), Regional Job Accessibility by Bicycle, Car and Transit (Critical Connections), Transit Span of Service (Critical Connections), Bridge Condition (System Stewardship), Culvert Condition (System Stewardship), Native Seeding and Planting (System Stewardship) and Physical Activity (Healthy Equitable Communities).
STRATEGIES & ACTIONS
- Transition the transportation sector away from dependence on fossil-based fuels.
- Invest in and encourage the transition of vehicle fleets to electric or non-fossil-based fuels.
- Partner to expand electric vehicle charging using non-fossil-based sources of energy.
- Implement a clean fuels standard.
- Integrate equity in siting of electric vehicle charging infrastructure.
- Support non-fossil-based sources of electricity for trucking, rail, aviation and maritime use.
- Encourage more efficient travel like grouping errands or activities into one trip, shortened trips, etc. when using transportation powered by fossil fuels.
- Make transportation and land use decisions that reduce total greenhouse gas emissions.
- Integrate transportation and land use decisions to encourage mode shifts and to reduce the distance needed to travel for daily needs.
- Support land use decisions and parking policies that expand walking, rolling, bicycling and transit options for people to get to destinations.
- Monitor, track and forecast greenhouse gas emissions as part of investment, program and project decision making.
- Develop state, regional, county and city climate action plans.
- Protect people and communities through regional approaches to mitigate risk from the changing climate and extreme weather.
- Integrate climate change considerations into transportation decision making and evaluate opportunities to mitigate risks.
- Develop corridor and regional vulnerability assessments.
- Coordinate with agencies on stormwater management within and on adjacent lands to the transportation system.
- Increase resiliency of people and communities by adapting infrastructure to withstand the changing climate.
- Adapt design and maintenance practices to increase the resiliency of the transportation system.
- Coordinate with partners to identify and implement transportation right-of-way uses that reduce threats to people from exposure to extreme weather and temperatures.
- Use economic, disaster and public health recovery efforts to rebuild in a way that is more resilient.
- Leverage data to inform investment and project development decisions and identify new approaches to climate adaptation.
- Prioritize infrastructure resiliency along critical freight corridors to ensure safe and efficient delivery of goods during adverse conditions.
Innovative solutions are needed to make our transportation system more resilient to climate change and extreme weather. A more resilient system can reduce health impacts and minimize disruptions to the travel of people and goods. The Climate Action strategies focus on emerging transportation issues not covered by other sections of the SMTP. Climate-related strategies and actions in the other SMTP objectives include reducing vehicle miles traveled, encouraging travel options other than driving alone and coordinating with local partners on land use planning. Many strategies and actions throughout Chapter 5 are part of a coordinated and comprehensive approach to climate action.
“The changing climate needs to be considered for future projects. While I may not see the change, I would love for my grandchildren to live in a better climate.” - Policy Panel and Online Discussion Board Participant
Critical Connections
Maintain and improve multimodal transportation connections essential for Minnesotans’ prosperity and quality of life. Strategically consider new connections that help meet performance targets and maximize social, economic and environmental benefits.
WHAT THIS IS ABOUT
The transportation system is a vital part of keeping Minnesotans connected to family, jobs, healthcare, schools, places of worship, shopping, recreation and entertainment. What is considered a critical connection is different for each person depending on where they live and each mode. Components of this objective include identifying key connections, ensuring transportation options and sharing responsibility to ensure critical connections.
Identifying key connections within and between communities is key to providing a complete, efficient and affordable transportation system. Critical connections vary by transportation mode and may be different for walking, rolling, bicycling, transit, driving and freight purposes. These connections differ in scale depending on how people and goods move across the state, throughout a region or within a community. Changes in our economy may warrant new freight connections or increase connectivity. Also, new investments are needed to increase system connectivity for people walking, rolling, bicycling and taking transit.
Ensuring transportation options can support communities by providing the necessary link between people and opportunities. Businesses need predictable and reliable access to suppliers and customers. People need access to jobs, school, food, childcare, health services and other destinations no matter where they live. To accommodate people who don't drive, it is necessary to provide various transportation options like complete accessible sidewalk networks, shared mobility services, transit, shuttles, etc. All communities are designed differently and need various types of transportation networks. A well-connected local network can promote mobility choice, reduce local trips by vehicle and positively impact the environment.
Providing transportation options is key to reducing per capita vehicle miles traveled (VMT). VMT is one measure that can help us understand how the system is serving all users in different communities across the state. It helps inform progress towards agency goals around safety, accessibility, person throughput and reducing emissions causing climate change.
Reducing VMT will look different depending on the geography, community and context. There may be more potential to reduce VMT in urban communities where denser development is more conducive to walking, biking and transit options. Rural communities have farther distances between destinations, fewer convenient multimodal options and less access to high-speed internet. Additionally, agriculture, manufacturing and tourism are important parts of Minnesota’s economy. Collaborating with partners to evaluate strategies for different geographic areas, populations, businesses and communities will allow for the balance between reduction in VMT and continued support to economic activity.
Sharing responsibility across all transportation partners is key to identifying, maintaining and enhancing priority connections. MnDOT and transportation partners strive to provide connections that prioritize people’s movement and quality of life. This includes sidewalks, bicycle routes, roadways, waterways, intercity and regional bus, airports and railways. All connections, regardless of level, location or transportation type, need to be coordinated with one another to ensure a connected Minnesota.
PERFORMANCE MEASURES
Table 5-4 lists performance measures related to the Critical Connections objective. More information on these performance measures can be found in Appendix I – Performance Measures.
TABLE 5-4: CRITICAL CONNECTIONS PERFORMANCE MEASURES
| Measure | Description | Current Condition | Target or Desired Direction | MnDOT’s Role | Reporting |
| Travel Time Reliability | Percent of person-miles traveled on the National Highway System (NHS) that are considered reliable | 84.9% in 2019 and 95.4% in 2021 | ≥90% | Lead | Percent and trend |
| Truck Travel Time Reliability | Index measuring the consistency of commercial truck travel times on the Interstate system | 1.48 in 2019 and 1.24 in 2021 | ≤1.5 | Lead | Number and trend |
| Vehicle Miles Traveled Per Capita | Number of miles traveled across Minnesota per capita (percentages shown in parentheses are the percent reduction from 2019) | 10,691 miles per capita (2019) 9,957 miles per capita (2021) |
| Partner | Number and trend and by urban, suburban and rural |
| Job Accessibility by Bicycle, Car and Transit | Average annual number of jobs accessible within 30-minutes during morning peak traffic by bicycle (on medium stress roads), driving and transit | 40,967 jobs accessible by bicycle (on medium stress roads) 586,940 jobs accessible by car 13,069 jobs accessible by transit (2019) | Increasing | Lead & Partner | Number and trend by mode |
| Traveler Delay | Average delay per person in the Twin Cities | 9.7 minutes (2018) | ≤9 minutes per weekday | Lead & Partner | Number and trend |
| Transit On-time Performance | Annual transit on-time performance within the Twin Cities and within Greater Minnesota | Twin Cities: Metro Transit Bus: 84.8% (2021) Greater Minnesota: 95.2% (2021) | Twin Cities: Metro Transit ≥90% Greater Minnesota: ≥90% | Partner | Percent and trend |
| Transit Span of Service | Measure communicating the percentage of public transportation services that meet minimum service guidelines for access in the Twin Cities and Greater Minnesota | Under Redevelopment | ≥90% | Partner | Percent and trend |
| Transit Ridership | Boardings recorded by public transit providers | Urban: 91.6 (2019) 38.1 (2021) (in millions) Rural: 11.5 (2019) 6.2 (2021) (in millions) | Increasing | Partner | Number and trend by Twin Cities Metropolitan Area and in Greater Minnesota |
| Air Transportation | Annual number of available seat miles offered from commercial service airports | MSP: 24.3 million (2019) 16.8 million (2021) Greater MN: 181,447 (2019) 131,952 (2021) | Increasing | Support | Number and trend |
Other related performance measures include: Emergency Response (Transportation Safety), ADA Compliance (System Stewardship), Greenhouse Gas Emissions (Climate Action), Multimodal Accessibility (Healthy Equitable Communities) and Physical Activity (Healthy Equitable Communities).
STRATEGIES & ACTIONS
- Provide equitable access to destinations and services.
- Address the needs of people most vulnerable in the transportation system using complete streets, context sensitive and Safe System approaches.
- Partner with other agencies on projects to create or expand connections within and between communities.
- Partner and invest in high-capacity transit services and transitway corridors where existing and planned land uses justify a high demand for transit services in urban areas.
- Increase accessibility for people walking, rolling, bicycling and taking transit as part of highway resurfacing and preservation projects, traffic operations and system design.
- Ensure efficient, affordable, reliable and safe movement of goods to support a vibrant and growing economy.
- Define priority networks and integrate the networks into decision making based on connectivity and access to destinations.
- Add new and improve existing first- and last-mile connections for better freight access to the transportation system.
- Address freight bottlenecks in the transportation system.
- Use technology for system optimization for all modes.
- Provide transportation options to connect people to services, employment, neighborhoods and other destinations.
- Develop and improve multimodal options including intercity passenger rail and intercity bus within and between cities and regions.
- Integrate transit with mobility options, shared mobility and micromobility through system improvements like mobility hubs and transit stations.
- Provide more flexibility in types, spans and frequency of transit service to better connect people with key destinations.
- Expand and modify the transportation network for safe and convenient options for people to walk, roll, bicycle and take transit.
- Support economic vitality through transportation investment.
- Identify and prioritize solutions with a high return on investment.
- Collaborate with partners early to leverage existing and planned transportation resources to support business development.
- Support and expand transportation programs that demonstrate potential to strengthen economic competitiveness.
- Meet regularly with economic development officials, freight carriers and other industry stakeholders to understand changing economic conditions and future freight transportation needs.
- Communicate the importance of freight movements to economic and community health.
- Follow a tiered, phased approach to addressing mobility and safety based on the following order of actions.
- Encourage walking, rolling, bicycling, carpooling and taking transit.
- Support and encourage technology solutions like telework and telehealth that provide virtual access to jobs and services.
- Leverage travel demand management strategies as part of comprehensive congestion management planning.
- Implement lower cost and targeted improvements before considering major expansion.
- Encourage modal shifts away from single-occupant vehicles through infrastructure improvements, education, programs and services.
- Use quick, low-cost and creative projects to gain public and institutional support for investing in permanent projects.
- Use data and community input to understand walking, rolling, bicycling and transit needs and preferences for vulnerable populations.
- Increase consumer awareness of transportation choices using education, outreach and incentives to inform travel decisions.
- Support complete streets implementation through education, trainings and technical assistance.
- Invest to make travel by non-single occupant vehicle more easily available and attractive to use.
Healthy Equitable Communities
Foster healthy and vibrant places that reduce disparities and promote healthy outcomes for people, the environment and our economy.
WHAT THIS IS ABOUT
Healthy equitable communities provide opportunities for everyone to reach their fullest potential. They connect people to employment, education, recreation, goods, services and more. Also, the places we live, work and play have considerable impact on health and wellbeing. Investments preserve and promote community identity and should be considered a part of the community. Not all places are the same and there is no one-size-fits-all transportation solution.
Unfortunately, transportation can be a barrier, especially for underserved communities such as BIPOC, people with disabilities, people with low incomes, people with limited English proficiency and others. Tailoring solutions to specific places, leads to projects that respect and complement people, the environment and our economy. This also helps ensure that Minnesota is advancing equitable access to opportunities, preserving the natural and cultural heritage for future generations and maintaining an environmentally and economically viable transportation system for all to use in the future.
Coordinating with local partners to develop and design places that reflect the character of the community help to advance the health of people, the environment and our economy. Supporting local strategies and development practices create employment opportunities and can lower housing and transportation costs.
Eliminating barriers and reducing disparities lead to healthy outcomes for all. Transportation provides connections to destinations, but often serves as a barrier for underserved communities. Engaging with people underserved by transportation decision making can aid in reducing inequities. Community-based organizations are able to help identify and remove barriers to participation. By identifying disparities, transportation partners can develop policies, programs and deliver projects that expand mobility and access.
Advancing the health of people and communities means expanding opportunities, access and mobility choices for people. Transportation partners should work with communities to support opportunities for convenient multimodal access. This can look like providing connections for physical activity or improving access to a park or recreation area. Also, transportation is an important part of the built environment, and contributes to healthier, more livable communities. By considering health and equity in transportation planning, transportation partners can develop new policies, programs and projects that will improve the health and wellbeing of people and the communities they live in.
PERFORMANCE MEASURES
Table 5-5 lists performance measures related to the Healthy Equitable Communities objective. More information on these performance measures can be found in Appendix I – Performance Measures.
TABLE 5-5: HEALTHY EQUITABLE COMMUNITIES PERFORMANCE MEASURES
| Measure | Description | Current Condition | Target or Desired Direction | MnDOT’s Role | Reporting |
| Air Quality | Number of criteria pollutants below National Ambient Air Quality Standards (NAAQS) threshold each year | Minnesota is in compliance with NAAQS | All criteria pollutants below threshold | Partner | Number of and which pollutants not meeting standards |
| Physical Activity | Percent of Minnesotans who bicycle or walk at least weekly | 35% of Minnesotans bicycle or walk at least weekly (2019) |
| Partner | Percent and by demographic segments |
| Transportation Cost | Measure of how much household income goes to transportation | In development | Work plan item | Support | Under consideration through SMTP Work Plan |
| Multimodal Accessibility | (i.e., destination access) for walking, bicycling and transit at a project- and program-level | In development | Work plan item | Lead & Partner | Under consideration through SMTP Work Plan |
| Increase in Transportation Equity | Transportation equity is directly influenced by improving multimodal access, reducing transportation costs and improving transportation safety | In development | Work plan item | TBD | Under consideration through SMTP Work Plan |
Other related performance measures include: Fatalities and Serious Injuries (Transportation Safety), Perception of Safe Walking and Bicycling (Transportation Safety), Transit Safety (Transportation Safety), ADA Compliance (System Stewardship), Workforce Participation (System Stewardship), Vehicle Miles Traveled (Critical Connections), Regional Job Accessibility by Bicycle, Car and Transit (Critical Connections) Transit Span of Service (Critical Connections) and Public Trust and Confidence (Open Decision Making).
STRATEGIES & ACTIONS
- Coordinate transportation and land use planning among transportation partners, stakeholders and the public.
- Design spaces that reflect the identity and priorities of the community, foster a sense of belonging and improve Minnesotans' quality of life.
- Collaborate with a broad set of stakeholders and partners on transportation planning as part of comprehensive, economic development and land use planning, coordination and review.
- Collaborate with partners to identify and plan economic development sites that can enhance transportation connectivity.
- Encourage compact development to enable job access through different modes.
- Identify opportunities to redesign or remove transportation barriers that divide or separate communities.
- Eliminate burdens and reduce structural inequities for people and communities disproportionately impacted by transportation.
- Work with community partners to identify and remove barriers to participating in transportation planning and decision making.
- Identify disparities in mobility and access and develop plans to reverse or eliminate these impacts through multimodal transportation solutions.
- Implement equity reviews for transportation or land use policies, planning, programs and projects.
- Develop and support community resources to reduce inequities in transportation.
- Accelerate technology solutions for accessible and reliable transportation.
- Pursue strategies to mitigate past effects of transportation construction.
- Reduce combined housing and transportation costs for cost-burdened households.
- Improve first- and last-mile connections in neighborhoods and job centers.
- Support the construction of complete streets and a connected network to accommodate walking, rolling, bicycling and transit.
- Educate people on the impacts transportation decisions have on housing costs.
- Expand and enhance public transportation to improve access across the state.
- Promote infill development and land use practices that support walkable and bikeable communities.
- Develop and support a diverse workforce in Minnesota.
- Promote job retention and creation in the core of communities to support community vitality.
- Ensure the transportation system supports job access for second and third shift workers.
- Collaborate with multisector partners to identify, understand and address gaps in workforce skills for current and future demand.
- Connect people to education, training and workforce development centers.
- Leverage transportation solutions to improve public health.
- Integrate health and equity considerations in transportation planning, programming and project delivery using a Health in All Policies approach.
- Support opportunities for physical activity through walking, rolling and bicycling.
- Implement programs and investments that improve air quality and reduce noise especially for people experiencing the greatest impacts.
- Ensure convenient multimodal access to open space, parks and recreation areas.
- Increase equitable access to healthy, culturally appropriate and sustainable food through transportation options.
- Align transportation assets and services with community needs during public health emergencies.
Open Decision Making
Make equitable transportation decisions through inclusive and collaborative processes that are supported by data and analysis.
WHAT THIS IS ABOUT
Transportation decision makers are stewards of the transportation system and have the responsibility to make informed choices and be open about how and why decisions are made. Decision makers need to rely on many different types of information and input to make responsible decisions supported by data and analysis, when applicable. This also requires balancing many, sometimes competing, priorities. Open, transparent and equitable decision making are essential to building better relationships and ensuring learning, understanding and trust.
Engaging with people using the transportation system means creating opportunities for people to influence decisions. Good engagement starts with understanding community wisdom and uses inclusive, accessible and varied tools to reach and hear communities. Communication must be effective; this means information is available, easy to find, culturally responsive and understandable. This includes using plain language and meeting the Americans with Disabilities Act (ADA) accessibility standards. Good engagement and communication result in decisions that better reflect the community’s priorities.
Engagement also requires being clear and specific about what decisions will be made and by whom. The public’s role in transportation decision making is not static. The process for each decision can and will likely be different. Engagement should ensure that people understand their role and what opportunities there are to influence the decision at hand. Engagement done early and often builds capacity for transportation partners and the public to work together.
Learning and understanding are essential in the decision-making process. Early coordination and collaboration are key to learning and understanding community goals, issues and concerns. Transportation partners should build better relationships to understand the unique needs of communities. Communication and education for the public is also crucial to meet Minnesota’s transportation goals. Open decision making includes communicating the big picture to develop support and mutual understanding of constraints and opportunities. Everyone can listen, learn and seek to understand the expertise that others are bringing into conversations. In partnerships, learning and understanding go both ways.
Ensuring transparent and equitable decision making is about building public trust through thoughtful communication, engagement and education. Transportation decision makers need to be accountable for the decisions they make, because the majority of transportation funding comes from the public through taxes and fees. Decision makers need to ensure public resources are used efficiently and effectively, and that decisions are well documented and communicated.
This work should be rooted in understanding and overcoming the history of transportation-related trauma and exclusion that underserved communities have historically faced. Some community groups—such as Black, Indigenous and People of Color (BIPOC)—may not be ready to start building relationships with agencies and staff. Trust in government beyond transportation agencies has been eroding over time especially in communities harmed by previous decisions.
Working with a variety of partners and community-based organizations can help get community input and data while making progress toward building trust and forming relationships. Asking a series of questions which include who is influencing decisions, who is potentially left out, who is burdened and who is benefitting by a transportation decision can help to advance transportation equity. The SMTP policy direction lays the groundwork of trust and relationship building to improve transportation decision making in the future.
PERFORMANCE MEASURES
Table 5-6 lists performance measures related to the Open Decision Making objective. More information on these performance measures can be found in Appendix I – Performance Measures.
TABLE 5-6: OPEN DECISION MAKING PERFORMANCE MEASURES
| Measure | Description | Current Condition | Target or Desired Direction | MnDOT's Role | Reporting |
| Public Trust and Confidence | Annual percent of respondents that agree with the following statements:
| 72% felt MnDOT understood their needs, 59% felt MnDOT acts in a financially responsible manner and 67% felt MnDOT was communicating accurately about transportation plans and projects (2020) | ≥80% overall and for each demographic segment | Lead | Percent and trend; report by different demographic segments |
| Project-Level Public Engagement Measures | e.g., post-project surveys | In development | Work plan item | Lead | Percent and trend |
| Partner Coordination | Measure MnDOT coordination with external partners during planning and programming | In development | Work plan item | Lead | Under consideration through SMTP Work Plan |
Other related performance measures include: Representation within MnDOT (System Stewardship).
STRATEGIES & ACTIONS
- Ensure people have opportunities to play an active and direct role in transportation decision making.
- Start transportation processes by working with communities to identify strategies that support people's vision, priorities and needs.
- Determine community demographics for plans, programs and projects and tailor public engagement approach to increase broad community participation and input.
- Create public engagement plans that clearly articulate decision points, who will be involved at each step of the process and who has authority over each decision.
- Include those impacted by transportation decisions as members of decision-making teams.
- Actively engage in community-centered conversations and use community wisdom to inform decision making.
- Create and implement processes and systems to monitor and evaluate effectiveness in achieving shared outcomes.
- Build and strengthen lasting relationships to ensure that people are engaged in transportation projects and activities especially with underserved communities.
- Commit to regular two-way communication with partners, stakeholders and the public to continuously gather feedback.
- Hire and involve community-based organizations to conduct and lead engagement activities with underserved populations.
- Identify and connect with Tribal Governments, local elected officials and community leaders through project scoping and delivery.
- Collaborate with partners to include transportation-related questions in their surveys and other data collection efforts with underserved communities.
- Coordinate with partners to ensure people's priorities and needs are considered including for those without reliable transportation choices.
- Provide education opportunities and programs for community members and transportation partners to understand each other on how to participate in transportation decision making together.
- Provide consistent, transparent, fair, just and equitable communication.
- Partner with the public and stakeholders to identify, develop and implement communication and engagement approaches.
- Use culturally appropriate communication and engagement methods and techniques.
- Set plain language and accessibility standards for agency and contractor deliverables and provide training for staff.
- Provide training for different communication methods including storytelling.
- Increase staff ability and provide resources to improve engagement for people with disabilities and limited English proficiency.
- Provide the public with clear information about overarching policy and project goals to help frame community engagement.
- Understand and learn from personal and community experiences on how the transportation system can negatively and positively affect communities.
- Co-create and share narratives about transportation in collaboration with communities that have been harmed by decisions related to the transportation system and built environment.
- Use the wisdom from community narratives to inform plans, manuals, training content, etc.
- Provide training and resources to build staff capacity to understand cumulative historical impacts of transportation decision making.
- Use research and data to drive decision making in pursuit of local, regional, Tribal, statewide and national goals.
- Ensure key transportation data is kept up-to-date, usable and easily accessible to transportation partners and the public.
- Track and share information about transportation needs and system performance to inform decision making.
- Increase use of accessible mapping tools and data visualization in communications with the public.
- Analyze and present data broken out by community and demographic segments to allow for meaningful analysis.
- Use qualitative data to advance transportation equity.
Modes and users of the transportation system
The SMTP is for all the ways people and goods move around Minnesota. The number of ways people and goods travel continues to change and evolve and now even includes substituting travel for virtual access.
AGRICULTURAL EQUIPMENT
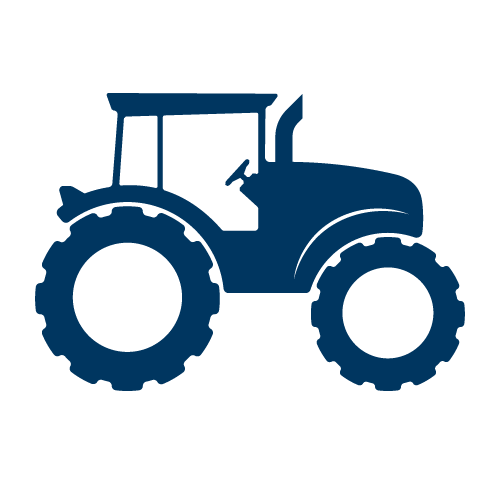
Agricultural equipment is not traditionally thought of as a mode, but nevertheless is often a use of the transportation system. Within the past few decades, there has been significant change in both farm size and farm equipment. Changes in agricultural practice have caused a faster shift to larger, heavier equipment than transportation technology and design can monitor and test. Transportation must ensure safe use of the system for agricultural equipment and others traveling in the area.
ANIMAL POWERED VEHICLES
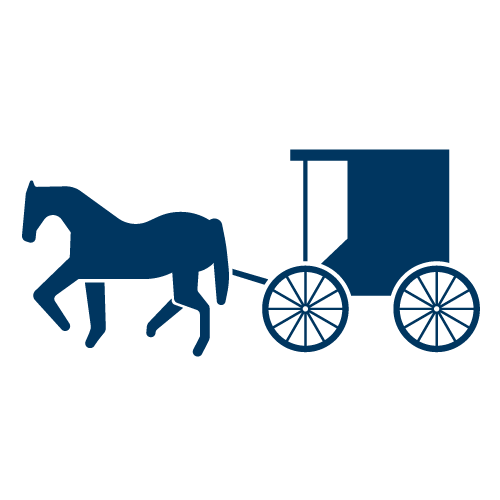
Communities using animal powered vehicles are often located along scenic routes, in agricultural areas, around economic centers and in natural and cultural areas. Transportation construction, operations and maintenance requires taking care to connect with and account for people traveling using animal powered vehicles. This needs to be balanced with the needs of a variety of users.


AVIATION
Aviation is central to social connections and economic development. Air mobility is about efficiency, speed and interconnectivity. Improvements in aviation are creating new opportunities to move people and goods. This mode is positioned to lead innovation and have big impacts on new mobility, sustainability and freight.


BARGES & SHIPS
The ports and waterways connect Minnesota’s people and goods to destinations around the US. Rail and water serve the agriculture, mining, manufacturing and trade sectors while air is mostly used for the transport of high-value manufactured goods and consumer products. New infrastructure, programs and services can bring opportunities to turn ports into hubs for innovation, mobility and sustainability.
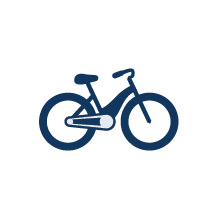
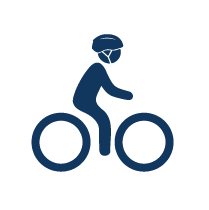
BICYCLES
Increasing the number of people traveling by bicycle can help meet vehicle miles traveled, physical activity and accessibility targets. Bicycle use varies by context and culture. New electric powered bicycles and cargo bicycles are increasing the ranges and uses of bicycles. Engineering solutions and education programs can provide more and better opportunities for people to ride their bicycles.
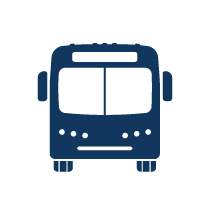
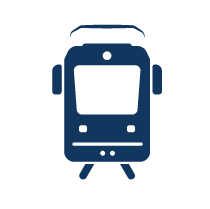
BUSES & LIGHTRAIL TRANSIT
Transit provided vital connections for frontline and essential workers during the pandemic. Transit services are key to connecting people to destinations both historically and now. Improvements and innovations are transforming transit from a service to an integrated mobility network. Transit can continue to innovate to help address congestion, health, safety, equity and sustainability.
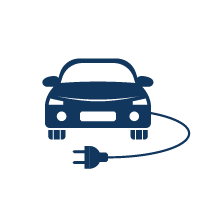
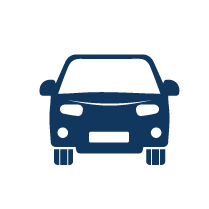
CARS, MOTORCYCLES, TRUCKS AND SPORT UTILITY VEHICLES
Motorized passenger vehicles are essential modes for the transportation system. These are the most commonly used forms of transportation in the state. Passenger vehicles provide essential first- and last-mile connections for people and goods. Evaluating and retooling programs and practices can help transportation partners continue to provide people a robust network that meets user needs now and into the future.
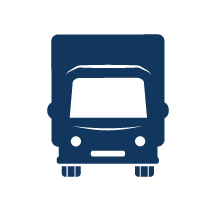
COMMERCIAL TRUCKING
The efficient movement of freight and commodities, including the movement of freight by truck, is a key consideration for transportation in Minnesota. Trucking is important to all industries, as even goods moving via other modes often use trucks for the first- and last-mile of the trip. Freight volumes are increasing, and commercial trucking will continue to serve a significant role in transportation and economic development.

MICROMOBILITY
Micromobility services—like electric kick scooters or bike share—provide versatile transportation options especially for shorter trips. Where consistently available, they provide people with options outside personally owning an automobile. These options also help make first- and last-mile connections for people traveling by other modes. Micromobility helps to serve an integrated multimodal transportation system.

PIPELINES
Pipelines, unlike the other modes of logistics, move through our daily lives unseen, whether buried beneath our feet or silently moving commodities overland through sparsely populated fields. Pipelines serve as a primary route to move crude oil to refineries and natural gas to power plants. This option will continue to have a logistics role in transportation.
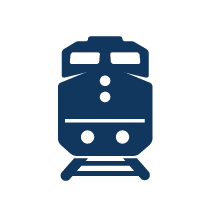
TRAINS
The railroad industry is growing and changing. New technology is refining physical systems. And new approaches and practices are improving safety and operations. These changes help boost economic growth, productivity, competitiveness and safety. Efforts are underway to increase intercity passenger rail options.
ATV AND SNOWMACHINES
ATVs and snowmachines often operate in transportation right-of-way traveling adjacent to or across roadways. In areas with fewer paved roads, they serve an important transportation function. These uses will continue to be considered and anticipated in areas where they provide recreational and transportation options.


VIRTUAL
While not traditionally considered a mode of transportation, virtual options are increasingly how people access goods, services and connect with family, friends, etc. Over time, virtual options have replaced part or all of some trips that used to be completed using another mode of travel. The future of transportation includes understanding the role of virtual services in connecting Minnesotans to goods and services.
WALKING
Most trips start and end with walking and rolling. Walking for daily or short trips can provide health and economic benefits. Investing in more opportunities for people to walk and roll are especially important in low-income communities and areas with Black, Indigenous and People of Color. Improvements need to focus on removing barriers for people walking and rolling.