
Chapter 5: Investment Direction
The investment direction presented in this chapter prioritizes investments to maintain the existing state highway pavements and bridges while making limited mobility improvements over the next 20 years. The direction will guide investments so that transportation projects align with statewide goals as much as possible with available funding.
MnDOT districts select projects that are consistent with the investment direction in MnSHIP.
The key messages of Chapter 5 are:
- MnDOT will make progress in all investment areas, but not all performance targets will be met. Pavement condition is expected to decline significantly.
- MnDOT will put most of its available revenues toward maintaining the existing transportation system, which is consistent with public and stakeholder input.
- MnDOT will apply multiple strategies to optimize resources and achieve multiple purposes through its planned investments.
Project Selection
While MnSHIP sets MnDOT’s investment priorities for a 20-year time period, MnDOT does not identify specific projects over the 20 years. MnDOT identifies potential projects in the first 10years of the plan through the 10-Year Capital Highway Investment Plan. The CHIP translates the 20-year investment direction into planned and programmed projects that collectively achieve the outcomes identified in MnSHIP. The CHIP consists of two time periods. Projects in Years 1-4 are a part of the State Transportation Improvement Program. Projects are programmed and scheduled in the STIP. MnDOT is committed to delivering these projects over the next four years. Projects in Years 5-10 are not yet committed. They are in the budget, but project timing, scope and cost may change. Together, projects in Years 1-10 comprise the 10-Year CHIP. The following sections explain how the investment direction will influence project selection in each year of the 20-year plan.
Influence of Investment Direction on Project Selection in Years 1 - 4
In the first four years (2018-2021) of MnSHIP, MnDOT has already committed to projects in the STIP based on the investment direction in the 2013 MnSHIP. MnDOT has spent funding to scope and develop these projects using that investment guidance. MnDOT tries to avoid any changes to projects in the STIP, if possible. Therefore, MnDOT is not changing projects in years 2018 to 2021 to reflect the updated investment direction.
Influence of Investment Direction on Project Selection in Years 5 - 10
MnSHIP investment direction will guide project selection from 2022 through 2027 with the publishing of the 2018-2027 10-Year CHIP. MnDOT developed the current 2017-2026 10-Year CHIP before the MnSHIP investment direction was finalized. The current projects listed in the 10-Year CHIP will be updated to reflect the MnSHIP investment direction and MnDOT will work to try to limit the changes to these projects. New projects will need to be identified to ensure that selected projects follow the investment direction in this plan.
Influence of Investment Direction on Project Selection in Years 11 - 20
MnDOT does not identify individual projects beyond 10 years in MnSHIP. Investment in those years is identified by investment category only. However, the CHIP is updated annually so new projects are added to Year 10 with each version of the CHIP. These new projects will follow the investment direction established in this document.
Additional information on project selection and investment programs can be found in Appendix E: MnSHIP Financial Summary.
Investment Summary
The 20-year investment direction focuses on maintaining the existing state highway system while making limited mobility investments. This approach reflects both MnDOT and stakeholder input and meets key requirements and agency commitments. It also continues a shift for MnDOT from being a builder of the system to the maintainer and operator of the system. The investment direction does not affect the projects already developed and programmed in Years 2018 through 2021. The priorities identified in this plan will be reflected in investments and projects starting in 2022. Figure 5-1 shows the distribution of expenditures through all years of the plan.
Figure 5-1: 20-Year Capital Highway Investment Direction
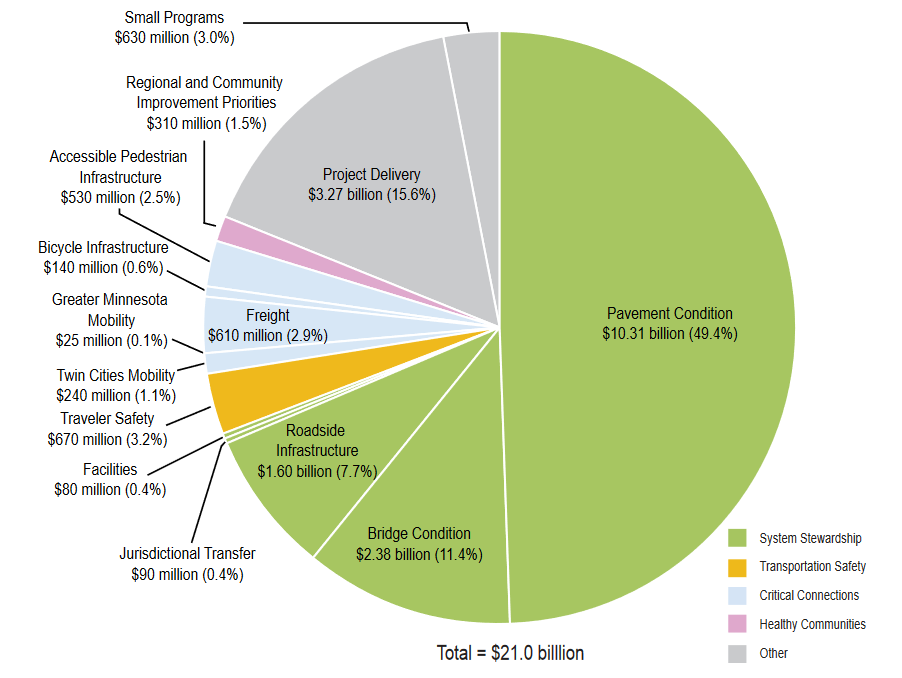
Figure 5-2: Total Investments, Outcomes, and Current Condition
| Investment Category | Objective Area | Current Conditions (2015) | Projected Outcome(s) in 2037 | Total Investment (2018-2037) |
| Pavement Condition | System Stewardship | Meet MnDOT targets and GASB 34 thresholds for NHS and Non-NHS pavement condition. • Interstate: 2.1% poor • NHS: 2.7% poor • Non-NHS: 5.1% poor | NHS and Non-NHS pavement condition worsen. Interstate condition worsens but meets federal minimum threshold. Maintain GASB 34 threshold on the NHS. • Interstate: 4.0% poor • NHS: 8.0% poor • Non-NHS: 18.0% poor | $10.31 billion |
| Bridge Condition | System Stewardship | Meet GASB 34 thresholds for both NHS and Non-NHS for bridge condition. Only Non-NHS meets MnDOT targets for bridge condition. • NHS: 3.0% poor • Non-NHS: 3.1% poor | Non-NHS bridge conditions worsen, while NHS bridge condition is maintained. GASB 34 thresholds are met but NHS thresholds are not. • NHS: 5.0% poor • Non-NHS: 7.0-8.0% poor | $2.38 billion |
| Roadside Infrastructure Condition | System Stewardship | Roadside infrastructure condition is not meeting targets. • Culverts: 13.0% poor • Deep Storm Water Tunnels: 24.0% poor • Overhead Sign Structures: 30.0% poor | The condition of all roadside infrastructure assets will be maintained. Condition targets for culverts, deep storm water tunnels and overhead sign structures will not be met. • Culverts: 14.0-15.0% poor • Deep Storm Water Tunnels: 23.0-24.0% poor • Overhead Sign Structures: 25.0% poor | $1.60 billion |
| Jurisdictional Transfer | System Stewardship | 2,653 miles of misaligned roads. Transfer of misaligned roads | MnDOT will transfer over 900 miles of roadway between the state and local agencies. | $90 million |
| Facilities | System Stewardship | 6.0% of rest areas in good condition and nearly half in poor condition. Repair or replacement of weigh scales is not keeping pace with need. | 6.0% of rest areas will remain in good condition. Weigh scale and weigh station replacement will not keep pace resulting in outdated or inoperable sites. | $80 million |
| Traveler Safety | Transportation Safety | Safety improvements are made proactively with low cost/high benefit projects. Total fatalities and serious injuries have plateaued after decade-long decline. | Safety improvements made at a reduced rate. There is limited ability to address locations with high sustained crash rates. Total fatalities and serious injures may see an increase. | $670 million |
| Twin Cities Mobility | Critical Connections | Congestion remains | Travel time reliability likely to decrease. Investments made in two MnPASS corridors and six spot mobility improvements between 2018 and 2023. | $240 million |
| Greater Minnesota Mobility | Critical Connections | A few corridors of mostly urban highways have decreased reliability during peak travel times. | Corridors likely to see decreased travel time reliability. Six to 10 operational and low-cost capital improvements are completed. | $25 million |
| Freight | Critical Connections | - | - | $610 million |
| Bicycle Infrastructure | Critical Connections | The condition of the state bicycle network is maintained and new bicycle improvements are being made where needed. | Reduced investment in new improvements and maintenance of existing bicycle infrastructure leads to deterioration of bicycle network. | $140 million |
| Accessible Pedestrian Infrastructure | Critical Connections | Progress is being made towards ADA-compliant pedestrian infrastructure. Non-ADA pedestrian improvements are limited. • Sidewalks not ADA compliant: 54.0% | Infrastructure on the pedestrian network will be substantially compliant with standards. Some non-ADA projects will increase pedestrian access. | $530 million |
| Regional and Community Improvement Priorities | Healthy Communities | Economic development and quality-of-life improvements are being made through partnerships and project upgrades. | MnDOT will respond to two to five economic development opportunities per year through the TED program. | $310 million |
| Project Delivery | Other | Invest the amount necessary to deliver projects in the other categories. | Invest the amount necessary to deliver projects in the other categories. | $3.27 billion |
| Small Programs | Other | - | Continue to invest in small programs such as off-system bridges and historic properties. | $630 million |
| Total | $21.0 billion |
Figure 5-3: Investment Direction by Time Periods
| INVESTMENT CATEGORIES | FY2018-2021 | FY022-2023 | FY2024-2037 |
| Pavement Condition | 33.5% | 47.3% | 52.9% |
| Bridge Condition | 15.6% | 8.2% | 9.7% |
| Roadside Infrastructure | 8.7% | 6.9% | 7.7% |
| Jurisdictional Transfer | 0.0% | 0.5% | 0.5% |
| Facilities | 0.0% | 0.4% | 0.5% |
| Traveler Safety | 4.2% | 3.1% | 3.1% |
| Twin Cities Mobility | 5.7% | 6.8% | 0.0% |
| Greater Minnesota Mobility | 0.0% | 1.4% | 0.0% |
| Freight | 2.8% | 2.7% | 3.0% |
| Bicycle Infrastructure | 0.8% | 0.5% | 0.6% |
| Accessible Pedestrian Infrastructure | 1.8% | 2.4% | 2.7% |
| RCIP | 3.3% | 1.2% | 1.0% |
| Project Delivery | 14.3% | 15.7% | 16.0% |
| Small Programs | 6.1% | 2.8% | 2.3% |
Distribution of investments over the 20 year time frame is not uniform. The investment direction has three phases as it transitions from the previous 2013 investment direction to the updated investment direction in this MnSHIP. Figure 5-3 shows the difference in investment breakdown over the 20 year time frame.
The first four years (2018-2021) of the MnSHIP investment direction represents the current projects, which are programmed in the STIP. Projects were selected based on 2013 investment direction guidance.
The next two years (2022-2023) of the investment direction reflects a transition between the 2013 MnSHIP investment direction and the updated investment direction in this plan. While the investment direction in these two years begins to shift towards an increased focus on maintaining the existing system over expanding the system there is continued investment in mobility projects. This represents the continued commitment to invest in mobility projects through 2023 identified in the 2013 plan and continued in this update.
After 2023, the investment direction reflects the priority to maintain the existing highway system. With no investment in mobility projects after 2023, investments in pavement condition, bridge condition and roadside infrastructure increase.
Biggest Strengths
The investment direction makes progress toward goals in all four investment objective areas. MnDOT’s priorities reflect the public’s input that calls for a diversified approach, as well as one that prioritizes maintenance of the transportation system. Outcomes for each investment area include:
- System Stewardship: MnDOT focuses a majority of investment on maintaining the condition of roads, bridges and roadside infrastructure. Pavement and bridge condition federal minimum thresholds are likely to be met.
- Transportation Safety: MnDOT will continue to focus on lower cost, proactive treatments aimed at preventing fatalities and serious injuries.
- Critical Connections: MnDOT commits to achieving substantial compliance with the Americans with Disabilities Act no later than 2037. MnDOT also commits to planned mobility investments in the Twin Cities metro area through 2023.
- Healthy Communities: Through the Transportation and Economic Development program, investments will be made to address local concerns through partnerships, design add-ons and a few stand- alone projects to support economic competitiveness and quality of life.
Biggest Drawbacks
The investment approach offers a limited response to increasing infrastructure and multimodal needs. Several challenges remain, including:
- System Stewardship: Conditions of roads, bridges and roadside infrastructure decline on NHS and non-NHS routes.
- Transportation Safety: Only a limited number of locations with a sustained crash history will be addressed.
- Critical Connections: The number and scope of mobility improvements decrease substantially, potentially reducing the ability to maintain reliable travel times in the Twin Cities area and Greater Minnesota. Resources are not available to address growing areas of the state.
- Healthy Communities:The investment direction limits MnDOT’s ability to address local concerns.
System Stewardship
The MnSHIP investment direction aligns with the System Stewardship objective and strategies in the Statewide Multimodal Transportation Plan. This objective emphasizes maintaining the state’s existing NHS highways, keeping the transportation system on a sustainable track for the future, considering multiple needs in programming and collaborating with partners.
MnDOT will not be able to invest in all assets at optimal points in their life-cycles due to funding limitations. Throughout the 20-year plan, MnDOT will prioritize infrastructure improvements on NHS routes and hold these roads to a higher performance standard than non-NHS routes. This approach allows MnDOT to comply with federal law and manage risks related to statewide travel.
While MnSHIP’s emphasis is on maintaining the existing system, MnDOT strives to achieve multiple objectives through coordinated investments. For example, drainage infrastructure (Roadside Infrastructure Condition) helps pavements last longer. Funding Bridge Condition at a high level of performance for all years of the plan supports traveler safety. Investing in Pavement Condition can enhance the bicycle and pedestrian network. MnDOT will ensure that the dollars spent in System Stewardship achieve optimal outcomes through:
- Innovation. Developing new materials, design standards and procedures.
- Low-cost maintenance and repairs. Using recycled materials, innovative design, and preventive maintenance treatments to extend the useful life of infrastructure without increasing costs.
- Alternate bidding. Planning for two comparable repair strategies (concrete versus bituminous) for some projects so contractors can bid the most cost-effective solution.
In addition to MnSHIP, MnDOT will continue to use planning and research to guide its stewardship of state highway assets. MnDOT completed its first risk-based asset management plan, the Transportation Asset Management Plan, in 2013. The plan helps MnDOT coordinate pavement, bridge and roadside infrastructure investments in order to make the most effective use of limited dollars. It will be updated to include additional assets, such as MnDOT-owned buildings along the state highway, noise walls, pedestrian infrastructure (e.g., sidewalks and curb ramps, traffic signals and lighting) and intelligent transportation systems.
Investment Priorities
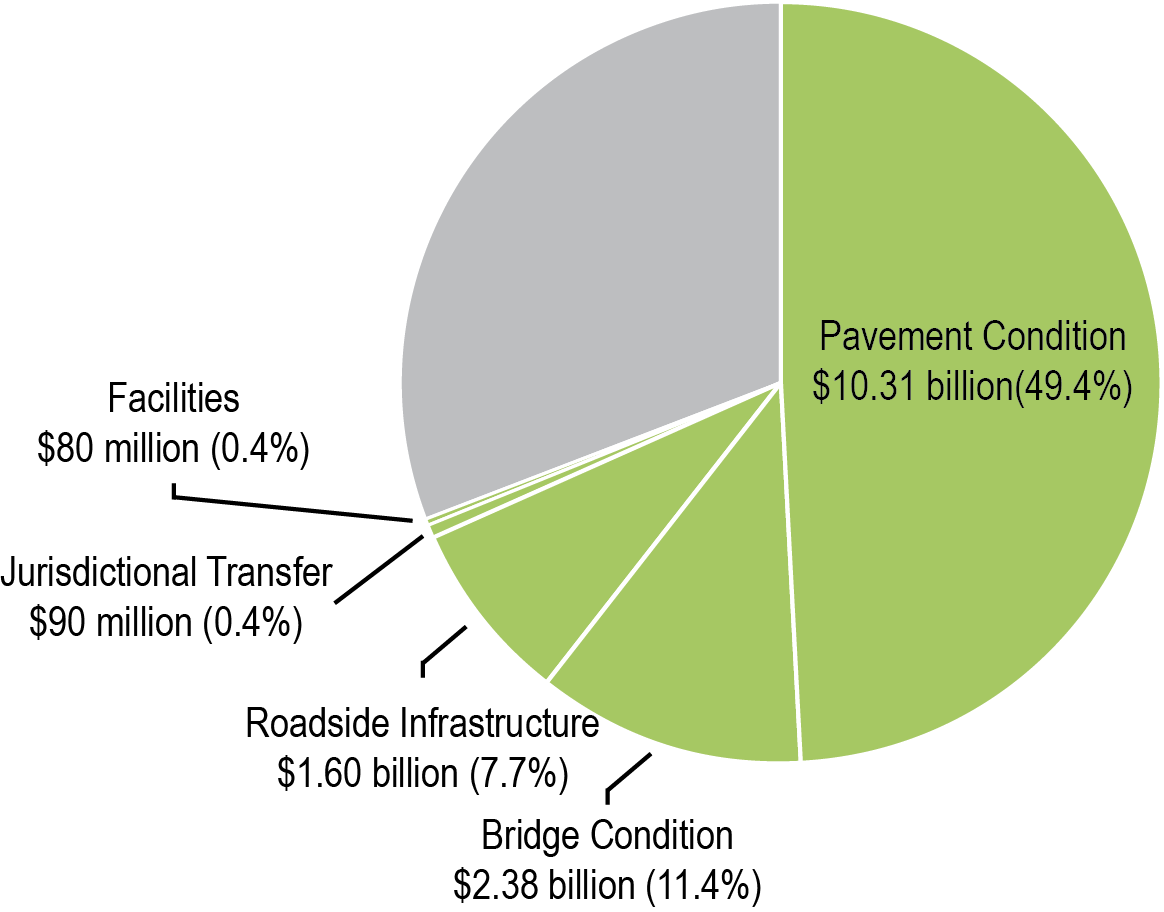
Figure 5-3 shows that system stewardship is expected to constitute approximately 69 percent ($14.6 billion) of MnDOT’s overall program for the 20-year planning period of MnSHIP.
Figure 5-3: System Stewardship Investments in MnSHIP
Pavement Condition
Projects that qualify as Pavement Condition investments include overlays, mill and overlays and reconstruction of existing roads.
Project Selection
MnDOT uses its Pavement Management System to predict future pavement conditions and develop a list of suggested fixes on NHS and non-NHS routes. The system uses funding assumptions based on statewide investment goals established in MnSHIP. The management system creates a preliminary 10-year list of potential projects. Projects on the NHS are selected through the Statewide Performance Program to achieve statewide outcomes on the NHS system. MnDOT districts then modify the list based on a number of considerations such as local knowledge of conditions, input from stakeholders, and timing of other projects in the area. The result is a list of projects that are included in the CHIP.
Districts also plan pavement improvements on non-NHS routes through the District Risk Management Program. In this program, the districts have more flexibility to set priorities for non-NHS pavement projects provided that the projects collectively meet the MnSHIP investment guidance.
More information on the SPP and DRMP programs can be found in Appendix D: MnSHIP Financial Summary.
Outcomes
Overall, MnDOT expects that the miles of pavement in poor condition will increase significantly by the end of the 20-year planning period. No MnDOT performance targets will be met. However, interstate pavements are expected to meet federal minimum thresholds. Pavement condition is expected to decline due to two key factors: 1) limited funding, and 2) the age of Minnesota’s roadways, many of which were constructed more than 40 years ago and require more expensive fixes. Conditions on the NHS and non-NHS are projected to decline most significantly.
At the end of the MnSHIP plan horizon (2037), the percentage of pavement in poor condition is expected to be:
- Interstate pavements: 4.0 percent (40 miles)
- Will not meet MnDOT target (2.0 percent or less poor)
- Is expected to meet federal minimum thresholds through 2037 - Other NHS pavements: 8.0 percent (230 miles)
- Will not meet MnDOT target (4 percent or less poor) - Non-NHS pavements: 18.0 percent (795 miles)
- Will not meet MnDOT target (10.0 percent or less poor)
- Will not meet GASB 34 threshold (15 percent or less poor)
System Investment Strategies
MnDOT may implement any of the following strategies to address the risks that remain with the level of investment in Pavement Condition:
- Focus on reactive maintenance activities (e.g., pothole patching) to avoid hazardous conditions
- Use of operational budget for maintenance of pavements
- Short-term fixes to address immediate needs
- Load posting, or restricting heavy vehicles, on select roadways
Bridge Condition
Bridge Condition includes the replacement, repair and painting of bridges.
Project Selection
As is the case with Pavement Condition, MnDOT prioritizes more investments in Bridge Condition on NHS roads than on non-NHS state highways.
MnDOT’s Bridge Office uses the Bridge Replacement and Improvement Management process and statewide goals to recommend bridge projects based on condition and risk factors. Risk factors can include the length of a potential detour and traffic volumes on the bridge. The Bridge Office and district offices generate a list of bridge projects for both NHS (through the SPP) and non-NHS bridges (through the DRMP) based on the results of the BRIM process. In modifying the BRIM results, districts consider stakeholder input and local expertise to coordinate timing with other planned projects in the region.
Districts primarily choose projects with long-term fixes for NHS bridges and focus investment on non-NHS bridges in the greatest need of repair.
Outcomes
Bridge conditions on both the NHS and non-NHS will worsen overall. However, the projected condition of both NHS and non-NHS bridges is expected to meet the federal minimum thresholds and the GASB 34 minimum conditions thresholds. Only non-NHS bridges will meet all MnDOT targets.
The percentage of bridge deck area in poor condition is expected to be as follows in 2037:
- NHS Bridges: 6.0 percent
- Will not meet MnDOT target (2.0 percent or less poor)
- Will likely meet the federal minimum threshold (10.0 percent or less poor)
- Meets GASB threshold (8.0 percent or less poor) - Non-NHS bridges: 7.0 - 8.0 percent
- Will likely meet MnDOT target (8.0 percent or less poor)
- Meets GASB threshold (20.0 percent or less poor)
System Investment Strategies
MnDOT may implement any of the following strategies to address the risks that remain with the level of investment in Bridge Condition:
- Maintenance activities focused on preventive repairs
- Deferment of long-term fixes
Roadside Infrastructure Condition
Roadside Infrastructure Condition elements include culverts, traffic signals, signs, lighting, retaining walls, fencing, noise walls, guardrails, overhead structures, Intelligent Transportation Systems and pavement markings.
Project Selection
MnDOT often repairs or replaces roadside infrastructure as part of a larger pavement and bridge project. Sometimes MnDOT carries out corridor-wide, stand-alone roadside infrastructure projects for assets such as culverts, signage, or lighting. Roadside infrastructure damaged from weather or crashes are usually repaired as part of routine maintenance and funded through the operations and maintenance budget.
Outcomes
In general, by 2037, the condition of the system’s roadside infrastructure elements is expected to remain relatively stable. However, NHS routes will receive more frequent upgrades to roadside infrastructure elements compared to non-NHS routes due to the relative frequency of pavement and bridge projects.
The percentage of roadside infrastructure in poor condition is expected to be as follows in 2037:
- Culverts: 14.0-15.0 percent
- Will not meet target (10.0 percent or less poor) - Deep Storm Water Tunnels: 23.0-24.0 percent
- Will not meet target (10.0 percent or less poor) - Overhead Signs (structure only): 25.0 percent
- Will not meet target (6.0 percent or less poor)
System Investment Strategies
MnDOT may implement any of the following strategies to address the risks that remain with the level of investment in Roadside Infrastructure Condition:
- Repair and replace infrastructure in poor condition or infrastructure beyond its service life
- Replace infrastructure with greatest exposure to the traveling public, mostly through pavement/bridge projects
Jurisdictional Transfer
Jurisdictional Transfer investments are needed capital investments to improve highways so they can be transferred from MnDOT to county or local governments or vice versa over the next 20 years.
Project Selection
Typically, a planned project is modified to include longer-term improvements and/or additional enhancements with agreement that a local agency would take ownership of the road. Transferring a road requires the agreement of both MnDOT and the local agency.
Outcomes
In combination with the $50 million already allocated to jurisdictional transfers, this additional level of investment would allow MnDOT to repair and transfer more than 900 miles of roads.
System Investment Strategies
MnDOT may draw from the following strategies, when necessary, to prioritize projects and address risks that are associated with lower performance or investment in Jurisdictional Transfer:
- Leverage other dedicated funding
- Commit to correcting roads with highest degree of mismatched ownership (i.e., those identified in Track 0 of the 2014 Minnesota Jurisdictional Realignment Project report)
- Balance investment between the Twin Cities area and Greater Minnesota
- Identify projects in the CHIP where investments could facilitate the transfer of ownership
Facilities
The Facilities investment category includes investments made to MnDOT buildings along state highways. These assets include rest areas, weight enforcement buildings and weigh scales. Facilities investments were previously made through either Roadside Infrastructure Condition or special capital programs.
Project Selection
New or renovated buildings are completed as stand-alone projects while pavement work on exit ramps or parking lots are typically completed in conjunction with another project on the adjacent highway.
Outcomes
At the level of investment included in MnSHIP, MnDOT expects the percentage of facilities needing significant renovation or replacement to increase. Investments in rest areas and weigh stations will be reactive, increasing maintenance costs and limiting MnDOT’s ability to keep many facilities in a state of good repair.
System Investment Strategies
MnDOT may draw from the following strategies, when necessary, to prioritize projects and address risks that are associated with lower performance or investment in Facilities:
- Prioritize health and safety-related repairs to rest areas unless replacement is warranted
- Focus investments on weigh scale mechanics and existing weigh station buildings
System Stewardship Overall Outcomes
Pavement, NHS bridges and roadside infrastructure assets will continue to deteriorate over the next 20 years. As a result, MnDOT will:
- Not meet MnDOT targets for any pavement system.
- Meet state and federal minimum thresholds for bridge condition although with a decrease in overall bridge system condition.
These targets represent desired performance levels, typically based on lowest life-cycle costs, customer expectations or policy priorities. MnDOT used these targets to calculate its estimated 20-year needs in these categories, as described in Chapter 3: Investment Needs.
It should be noted that some roadside infrastructure assets, the Jurisdictional Transfer and Facilities categories do not have performance targets. In these cases, investments will be guided based on the goals MnDOT would like to achieve in each investment category.
Figure 5-4 shows MnDOT’s performance goals for Pavement Condition, Bridge Condition and certain Roadside Infrastructure assets for which performance targets have been adopted. The anticipated pavement condition, bridge conditions, and roadside infrastructure on the state highway system are shown in the column on the far right. These outcomes meet the minimum thresholds established for GASB 34 and federal performance measures. However, many outcomes do not meet MnDOT targets.
Figure 5-4: System Stewardship Performance Targets and Outcomes
| investment category | system | target | gasb 34 Minimum condtion threshold | projected outcomes (2037) |
|---|---|---|---|---|
| Pavement Condition | Interstate | 2.0% poor (or less) | 10.0% poor (or less) (all NHS) | 4.0% poor |
| Pavement Condition | Other NHS | 4.0% poor (or less) | 10.0% poor (or less) (all NHS) | 8.0% poor |
| Pavement Condition | Non-NHS | 10.0% poor (or less) | 13.0% poor (or less) | 18.0% poor |
| Bridge Condition | NHS | 2.0% poor (or less) | 8.0% poor (or less) | 5.0% poor |
| Bridge Condition | Non-NHS | 8.0% poor (or less) | 20.0% poor (or less) | 7.0-8.0% poor |
| Roadside Infrastructure Condition | Culverts | 10.0% poor (or less) | N/A | 14.0-15.0% poor |
| Roadside Infrastructure Condition | Deep Storm Water Tunnels | 10.0% poor (or less) | N/A | 23.0-24.0% poor |
| Roadside Infrastructure Condition | Overhead Sign Structures | 6.0% poor (or less) | N/A | 25.0% poor |
Figure 5-5 - System Stewardship Outcomes and Total Investment
| Investment Category | Objective Area | Current Conditions (2017) | Projected Outcome(s) in 2037 | Total Investment (2018-2037) |
|---|---|---|---|---|
| Pavement Condition | System Stewardship | Meet MnDOT targets and GASB 34 thresholds for NHS and Non-NHS pavement condition. • Interstate: 1.9% poor • NHS: 3.0% poor • Non-NHS: 4.0% poor | NHS and Non-NHS pavement condition worsen. Interstate condition worsens but meets federal minimum threshold. Maintain GASB 34 threshold on the NHS. • Interstate: 4.0% poor • NHS: 8.0% poor • Non-NHS: 18.0% poor | $10.31 billion |
| Bridge Condition | System Stewardship | Meet GASB 34 thresholds for both NHS and Non-NHS for bridge condition. Only Non-NHS meets MnDOT targets for bridge condition. • NHS: 4.5% poor • Non-NHS: 1.3% poor | Non-NHS bridge conditions worsen, while NHS bridge condition is maintained. GASB 34 thresholds are met but NHS thresholds are not. • NHS: 5.0% poor • Non-NHS: 7.0-8.0% poor | $2.38 billion |
| Roadside Infrastructure Condition | System Stewardship | Roadside infrastructure condition is not meeting targets. • Culverts: 13.0% poor • Deep Storm Water Tunnels: 24.0% poor • Overhead Sign Structures: 30.0% poor | The condition of all roadside infrastructure assets will be maintained. Condition targets for culverts, deep storm water tunnels and overhead sign structures will not be met. • Culverts: 14.0-15.0% poor • Deep Storm Water Tunnels: 23.0-24.0% poor • Overhead Sign Structures: 25.0% poor | $1.60 billion |
| Jurisdictional Transfer | System Stewardship | 2,653 miles of misaligned roads. Transfer of misaligned roads continues | MnDOT will transfer more miles of roadway between the state and local agencies. | $90 million |
| Facilities | System Stewardship | 6.0% of rest areas in good condition and nearly half in poor condition. Repair or replacement of weigh scales is not keeping pace with need. | 6.0% of rest areas will remain in good condition. Weigh scale and weigh station replacement will not keep pace resulting in outdated or inoperable sites. | $80 million |
| Total | $14.46 b |
Transportation Safety
Traveler Safety
Funding for traveler safety in MnSHIP will allow MnDOT to continue its comprehensive approach to improving traveler safety on state highways. As described in Chapter 1: Plan Overview, MnDOT currently uses a combination of three types of safety investments in its effort to improve safety and reduce the number of fatalities and serious injuries on Minnesota roads:
- Proactive lower cost, high-benefit safety features
- Sustained crash locations treatments
- Investments identified as part of the Highway Safety Improvement Program
The Highway Safety Improvement Program is a federal program that emphasizes data-driven, strategic approaches to improving highway safety. HSIP projects correct a hazardous road location or address a highway safety problem.
The level of investment provides MnDOT limited ability to address locations with a sustained crash history. Due to changes in federal requirements, MnDOT will no longer provide capital funding for the Toward Zero Deaths initiative goals to promote enforcement and education efforts with its partners.
Investment Priorities
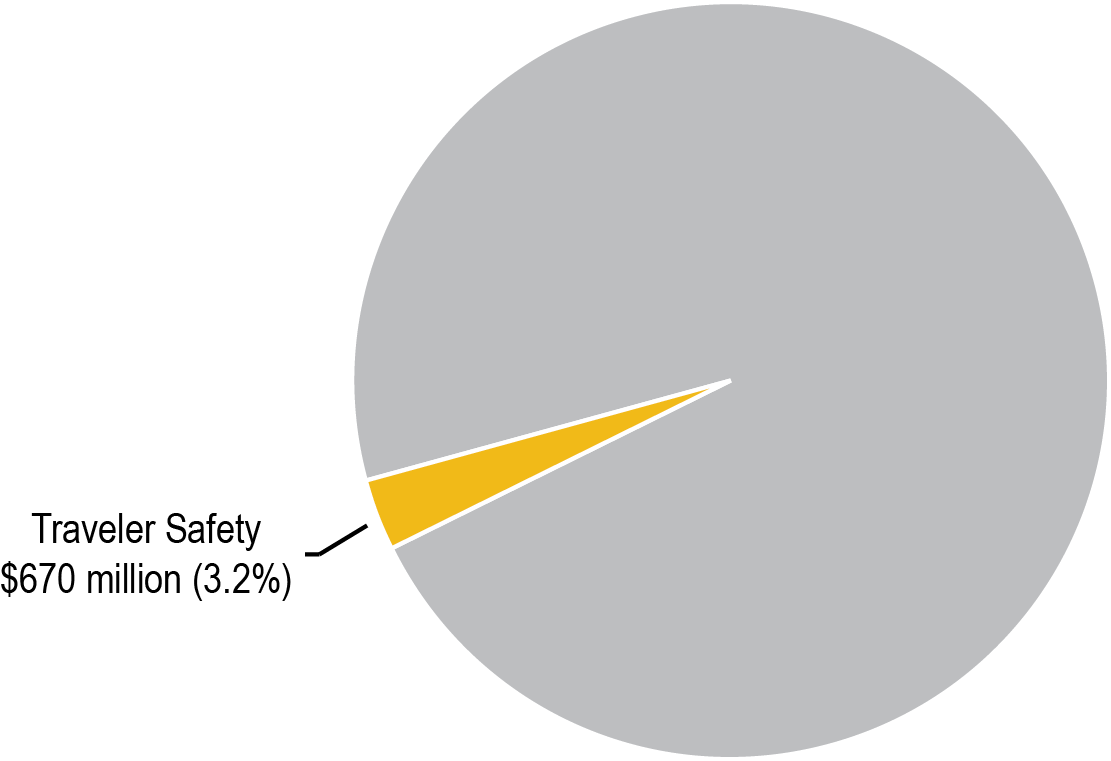
As shown in Figure 5-6, MnDOT anticipates spending approximately 3.2 percent of its program on Traveler Safety for the 20-year planning period of MnSHIP.
Figure 5-6: Traveler Safety Investment in MnSHIP
Project Selection
MnDOT selects safety projects on the NHS in coordination between its districts and the Office of Traffic, Safety and Technology. The mix of project types varies by district. Districts draw from two main sources to select projects:
- District Safety Plans: Each district uses its DSP to prioritize safety infrastructure projects and determine which strategic improvements to implement. In addition, the 10-Year Capital Highway Investment Plan includes Highway Safety Improvement Program investments.
- Sustained crash locations list: MnDOT’s Office of Traffic, Safety and Technology identifies areas throughout the state that experience a high crash rate over a five-year period. Districts include high-priority projects at some of these locations.
The districts also estimate the costs associated with installing roadway safety infrastructure as part of other projects, namely pavement improvements.
Outcomes
MnDOT districts will continue installing safety features as part of pavement projects; however, the rate of implementing DSPs will be cut by one third. Lower cost, high-benefit safety infrastructure will be constructed at priority locations throughout the state highway system, and select moderate to high-cost projects will be funded to address sustained crash locations. MnDOT will continue to participate in the TZD program.
Fatalities have been reduced substantially over the past 10 years. While MnDOT will continue to make investments in Traveler Safety, the goal of TZD cannot be achieved through infrastructure improvement alone. Even full implementation of all identified safety projects may do little to prevent fatalities and serious injuries that are a result of driver behavior such as distracted or impaired driving.
System Investment Strategies
MnDOT may draw from the following strategies, when necessary, to prioritize projects and address risks that are associated with lower performance or investment in Traveler Safety:
Invest in high priority, lower cost proactive projects
Reactively install lighting at sustained crash locations
Figure 5-7 summarizes expected Traveler Safety outcomes based on MnDOT’s investment priorities for MnSHIP and compares them to current conditions.
Figure 5-7: Transportation Safety Outcomes and Total Investment
| Investment Category | Objective Area | Current Conditions (2017) | Projected Outcome(s) in 2037 | Total Investment (2018-2037) |
|---|---|---|---|---|
| Traveler Safety | Transportation Safety | Safety improvements are made proactively with low cost/high benefit projects. Total fatalities and serious injuries have plateaued after decade-long decline. | Safety improvements made at a reduced rate. There is limited ability to address locations with high sustained crash rates. Total fatalities and serious injures may see an increase. | $670 million |
| Total | $670 M |
Critical Connections
Critical Connections includes mobility investments for many types of highway users, including those driving automobiles, freight carriers, bicyclists and pedestrians. MnSHIP’s investment categories within Critical Connections recognize the importance of the multimodal connections detailed in the Statewide Multimodal Transportation Plan. The categories of Twin Cities Mobility and Greater Minnesota Mobility reflect that the state’s mobility needs vary by geographical region, road volume and usage. Bicycle Infrastructure and Accessible Pedestrian Infrastructure help MnDOT better track its progress toward multimodal objectives on the state highway system—recognizing the need for building a safe transportation network that serves all Minnesotans. MnDOT also added one new investment category, Freight, for MnSHIP. The Freight investment category includes new federal funding and the upcoming Freight Investment Plan will determine how to invest within this category.
Investment Priorities
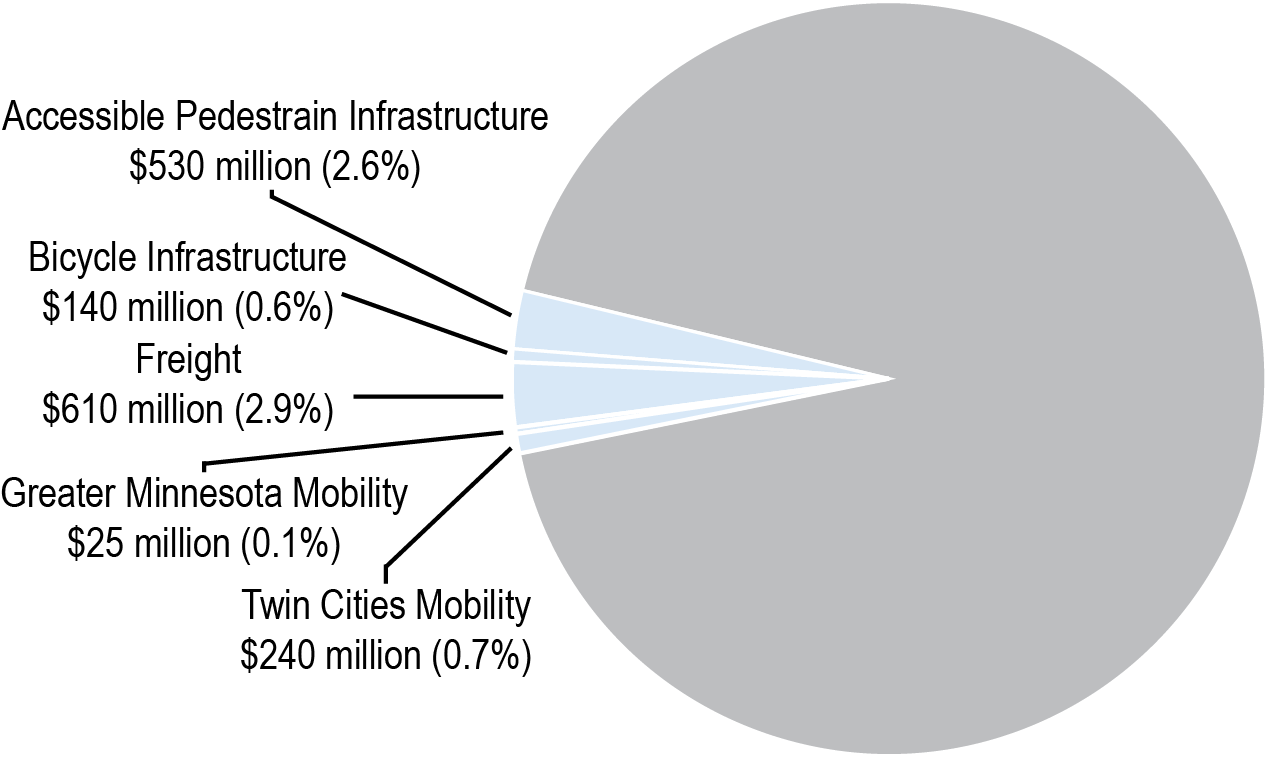
Critical Connections is expected to constitute 7.3 percent of MnDOT’s investment through all years of the plan (Figure 5-8).
Twin Cities Mobility
The goal of the Twin Cities Mobility investment category is to enhance the movement of people, freight and transit on highways in the Twin Cities area. Twin Cities Mobility investment category focuses on this by improving travel time reliability.
MnDOT’s strategy for maintaining travel reliability in the Twin Cities metropolitan area has moved away from traditional highway expansion. Twin Cities mobility projects follow the strategies laid out by the Metropolitan Council, the regional Metropolitan Planning Organization, in its 2040 Transportation Policy Plan. The strategies include four types of highway mobility improvements:
- Active Traffic Management
- Spot mobility improvements
- MnPASS express lanes
- Major capacity investments
Figure 5-8: Critical Connections in MnSHIP
Project Selection
MnDOT’s Metro District works in collaboration with the Metropolitan Council to develop a list of Twin Cities mobility projects that best align both statewide goals within MnSHIP and the Council’s Transportation Policy Plan. This approach addresses federal and state performance measures while also coordinating investments in other strategies that improve mobility on Twin Cities area highways through innovation, technology and multimodal options.
Many identified projects in Metro District’s 10-Year Capital Highway Investment Plan originated in previous planning efforts, such as the Metropolitan Council’s 2040 TPP, MnDOT’s Congestion Management Safety Plan (for potential spot mobility projects), and MnPASS and other system studies completed in partnership with the Metropolitan Council. Twin Cities Mobility projects are often coordinated with bridge and pavement replacement projects to minimize travel disruptions and project costs.
Outcomes
Based on the investment direction in MnSHIP, MnDOT will be extremely limited in its ability to invest in Twin Cities Mobility. Over the 20-year plan period, MnDOT and the Metropolitan Council will invest in Twin Cities Mobility to implement the following:
- Approximately six spot mobility improvements
- Completion of MnPASS express lanes along two corridors
While these projects will help improve travel reliability, it is still anticipated to worsen through 2037 relative to today due to anticipated regional growth and the related increase in mobility needs across the system.
System Investment Strategies
MnDOT may draw from the following strategies, when necessary, to prioritize projects and address risks that are associated with lower performance or investment in Twin Cities Mobility:
- Focus on investments that provide reliable congestion-free options on Twin Cities metro area corridors
- Focus on low cost spot mobility projects that provide safety benefits and reduce delays
Greater Minnesota Mobility
The goal of Greater Minnesota Mobility investments is to enhance the movement of people and freight in Greater Minnesota. It focuses on improving travel time reliability on the NHS through operational and low-cost capital improvements.
Project Selection
MnDOT prioritizes Greater Minnesota Mobility investments by considering the reliability of traffic flow on the NHS. Once the Federal Highway Administration finalizes the mobility performance measures for the NHS, MnDOT will set targets for those measures. These targets will inform where investments are necessary to meet the reliability and mobility goals for the NHS. MnDOT has not selected projects to be funded through Greater Minnesota Mobility for Years 1-4, as the category (formerly IRC Mobility) was not funded through MnSHIP 2013. MnDOT will re-evaluate the extent and location of performance-based needs on the NHS once performance measures are determined.
In addition to the investment in Greater Minnesota Mobility, there are projects listed in the 10-Year Capital Highway Investment Plans that will improve safety and mobility on the NHS in Greater Minnesota. These projects are categorized under other investment categories because they do not address a performance-based need.
Outcomes
Before specific projects are selected, MnDOT will need to establish performance targets for federal NHS mobility performance measures. The federal performance measures for mobility are not yet finalized. However, the investment in Greater Minnesota Mobility in MnSHIP could complete 6-10 operational and low-cost capital improvements on the NHS.
System Investment Strategies
MnDOT may draw from the following strategies, when necessary, to prioritize projects and address risks that are associated with lower performance or investment in Greater Minnesota Mobility:
- Focus investment to improve travel time reliability through operational improvements such as upgraded traffic signals, ITS, turn lanes and passing lanes
Freight
The goal of the Freight investment category is to improve the efficient movement of freight. The investment in the Freight category identified in MnSHIP reflects the amount provided for the National Highway Freight Program as part of the federal transportation legislation, Fixing America’s Surface Transportation Act. Freight improvements on the highway system will be identified in the Minnesota Freight Investment Plan.
Project Selection
MnDOT has selected projects in Years 1-4 using funding from the National Highway Freight Program. Additional projects will be selected using criteria from the upcoming Freight Investment Plan being led by MnDOT. MnDOT will work to develop a project selection process to identify projects in Years 5-10 of the CHIP once the investment plan has been completed.
Outcomes
MnDOT will project investment outcomes as part of the upcoming Freight Investment Plan. At this time, MnSHIP does not project outcomes for the Freight investment category.
System Investment Strategies
System investment strategies for the Freight investment category will be explored in the upcoming Freight Investment Plan.
Bicycle Infrastructure
MnDOT typically constructs bicycle improvements at the same time as pavement and bridge projects, but also implements some stand-alone projects in urban areas or areas with high volumes of bicycle traffic.
Project Selection
MnDOT districts identify their investments in Bicycle Infrastructure for Years 1-10 based on their highest risks and planned bridge and pavement projects for these years. Investments are generally made in conjunction with bridge or pavement projects. Bicycle improvements are occasionally made as a part of stand-alone bicycle projects.
The Statewide Bicycle System Plan, completed in 2016, identifies priorities for the type of facility, such as separated bike lanes, and general locations for investments, such as in urban areas. Eventually bicycle and pedestrian planners, working with districts, will identify a priority bikeway network, which will include both state highways and local roads. This effort will help MnDOT districts identify where bicycle facilities projects on state highways should be a priority.
Outcomes
MnDOT will invest in Bicycle Infrastructure at 75 percent of the current rate of investment. This will result in limited ability to make new improvements for bicycling and to maintain existing bicycle infrastructure as a part of pavement and bridge projects. Existing bicycle infrastructure will deteriorate and negatively affect the goal of promoting and increasing bicycling in Minnesota.
System Investment Strategies
MnDOT may draw from the following strategies, when necessary, to prioritize projects and address risks that are associated with lower performance or investment in Bicycle Infrastructure:
- Focus 70 percent of bicycle investments in urban areas and 30 percent of investments in rural areas
- Add to existing bridge and pavement projects to improve safety and connectivity of the state bikeway system
Accessible Pedestrian Infrastructure
Improvements made to pedestrian infrastructure, whether as a result of ADA requirements or not, are typically implemented as part of pavement or bridge projects. However, stand-alone projects are also implemented where needed.
Project Selection
Each district has varying pedestrian and ADA infrastructure needs. The districts select their 10-year investments in this category based on planned bridge and pavement projects, ADA needs identified via MnDOT’s ADA Transition Plan and inventory, and highest-risk pedestrian areas. Through collaboration between MnDOT districts and MnDOT’s ADA Office, MnDOT identifies existing non-compliant sidewalks along any scheduled pavement or bridge project. MnDOT takes the opportunity to repair the sidewalk to bring it into compliance. Some additions of ADA-compliant facilities and elimination of pedestrian “gaps” are also completed where needed. Some stand-alone ADA projects can also be selected to repair non-compliant sidewalks in locations where there is not an upcoming pavement or bridge project identified.
Outcomes
MnDOT is committed to achieving substantial ADA compliance of the state pedestrian network by 2037. Districts will fund a range of pedestrian and ADA projects based on their needs. Investments will be primarily curb ramps, sidewalks and accessible pedestrian signals at intersections, implemented concurrently with pavement and bridge projects. MnDOT will be able to complete some stand-alone ADA improvements, focusing on complete streets and filling gaps in the sidewalk network.
System Investment Strategies
MnDOT may draw from the following strategies, when necessary, to prioritize projects and address risks that are associated with lower performance or investment in Accessible Pedestrian Infrastructure:
- Focus more investment in sidewalks, curb ramps and accessible pedestrian signals
- Make other pedestrian improvements via complete street and to complete gaps in the network
Figure 5-9 summarizes expected Critical Connections outcomes based on MnDOT’s investment priorities for MnSHIP and compares them to current conditions.
Figure 5-9: Critical Connections Outcomes and Total Investment
| Investment Category | Objective Area | Current Conditions (2017) | Projected Outcome(s) in 2037 | Total Investment (2018-2037) |
|---|---|---|---|---|
| Twin Cities Mobility | Critical Connections | Congestion remains relatively flat. MnPASS express lanes and spot mobility improvements are completed where needed. | Travel time reliability likely to decrease. Investments made in two MnPASS corridors and six spot mobility improvements between 2018 and 2023. | $240 million |
| Greater Minnesota Mobility | Critical Connections | A few corridors of mostly urban highways have decreased reliability during peak travel times. | Corridors likely to see decreased travel time reliability. Six to 10 operational and low-cost capital improvements are completed | $25 million |
| Freight | Critical Connections | - | - | $610 million |
| Bicycle Infrastructure | Critical Connections | The condition of the state bicycle network is maintained and new bicycle improvements are being made where needed. | Reduced investment in new improvements and maintenance of existing bicycle infrastructure leads to deterioration of bicycle network. | $140 million |
| Accessible Pedestrian Infrastructure | Critical Connections | Progress is being made towards ADA-compliant pedestrian infrastructure. Non-ADA pedestrian improvements are limited. • Sidewalks not ADA compliant: 54.0% | Infrastructure on the pedestrian network will be substantially compliant with standards. Some non-ADA projects will increase pedestrian access. | $530 million |
Total | $1.50 b |
Healthy Communities
Regional and Community Improvement Priorities
The Minnesota GO Vision and Statewide Multimodal Transportation Plan emphasize the importance of accountability, transparency and communication. Although MnDOT pursues these objectives in all investment areas, Regional and Community Improvement Priorities, or RCIPs, are the primary outlet for collaboration with local agencies. RCIPs help MnDOT to complete projects that enhance accessibility, increase communication with stakeholders, and deliver transportation projects that maximize benefits to the community. Implementing RCIP projects allows MnDOT to partner with local agencies and leverage state resources to achieve multiple purposes.
Investment Priorities
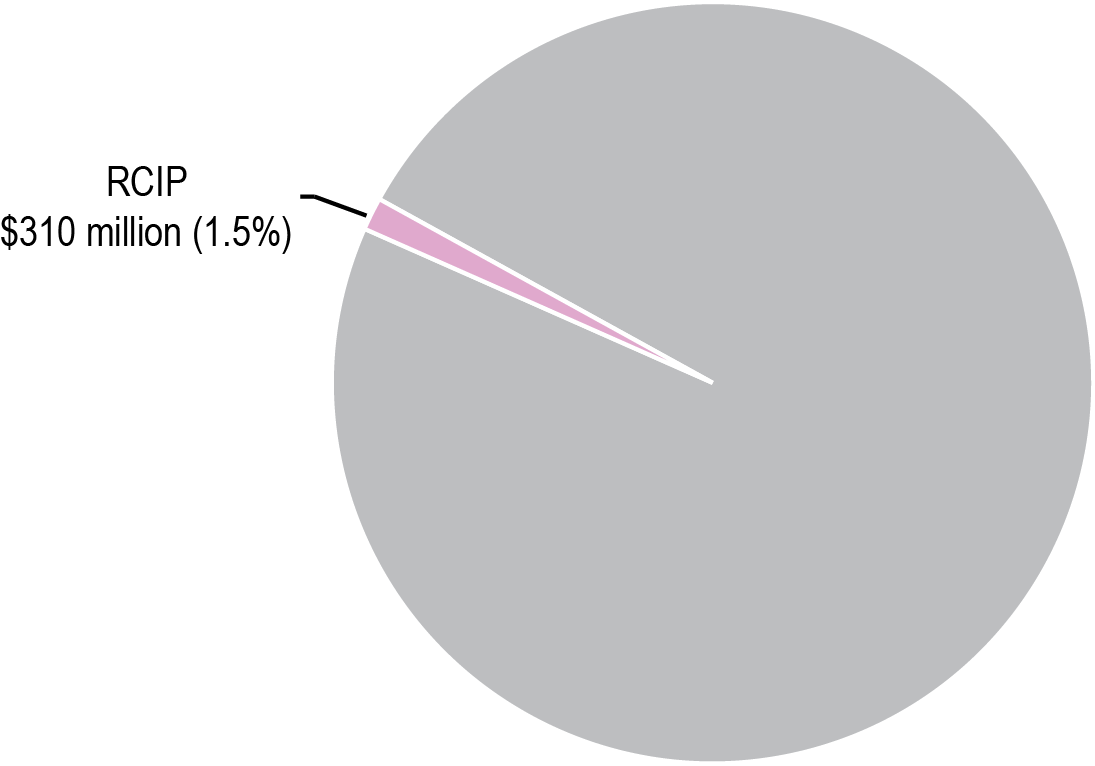
MnDOT anticipates spending approximately 1.5 percent of its program on RCIPs in all years of the plan (Figure 5-10).
Figure 5-10: Healthy Communities in MnSHIP
Project Selection
MnDOT selects projects through statewide solicitations to partner with stakeholders and local jurisdictions to address non-performance-based needs. These statewide solicitations fund projects that leverage local funds to provide economic, quality of life and transportation benefits. An example of a statewide solicitation is the Transportation Economic Development or TED program.
Additional RCIP investment gives MnDOT districts flexibility to address non-performance based needs that are important to local transportation partners. These RCIP investments are often tied to pavement and bridge projects.
Outcomes
MnSHIP will invest $310 million in RCIPs through 2037. Most investments will be completed through partnerships and design add-ons to existing projects. Stand-alone RCIP projects will be limited. The vast majority of improvements will be made through the TED program.
System Investment Strategies
MnDOT may draw from the following strategies, when necessary, to prioritize projects and address risks that are associated with lower performance or investment in RCIPs:
Maintain the TED program
Expand partnerships with local agencies/communities that leverage funds to complete larger projects
Figure 5-11 summarizes the outcomes related to Healthy Communities improvements on the state highway system based on MnDOT’s investment priorities for MnSHIP and compares them to existing priorities.
Figure 5-11: Healthy Communities Outcomes and Total Investment
| Investment Categorty | Objective Area | Current Conditions (2017) | Projected Outcome(s) in 2037 | Total Investment (2018-2037) |
|---|---|---|---|---|
| Regional and Community Improvement Priorities | Healthy Communities | Economic development and quality-of-life improvements are being made through partnerships and project upgrades. | MnDOT will respond to two to five economic development opportunities per year through the TED program. | $310 million |
| Total | $310 m |
Other
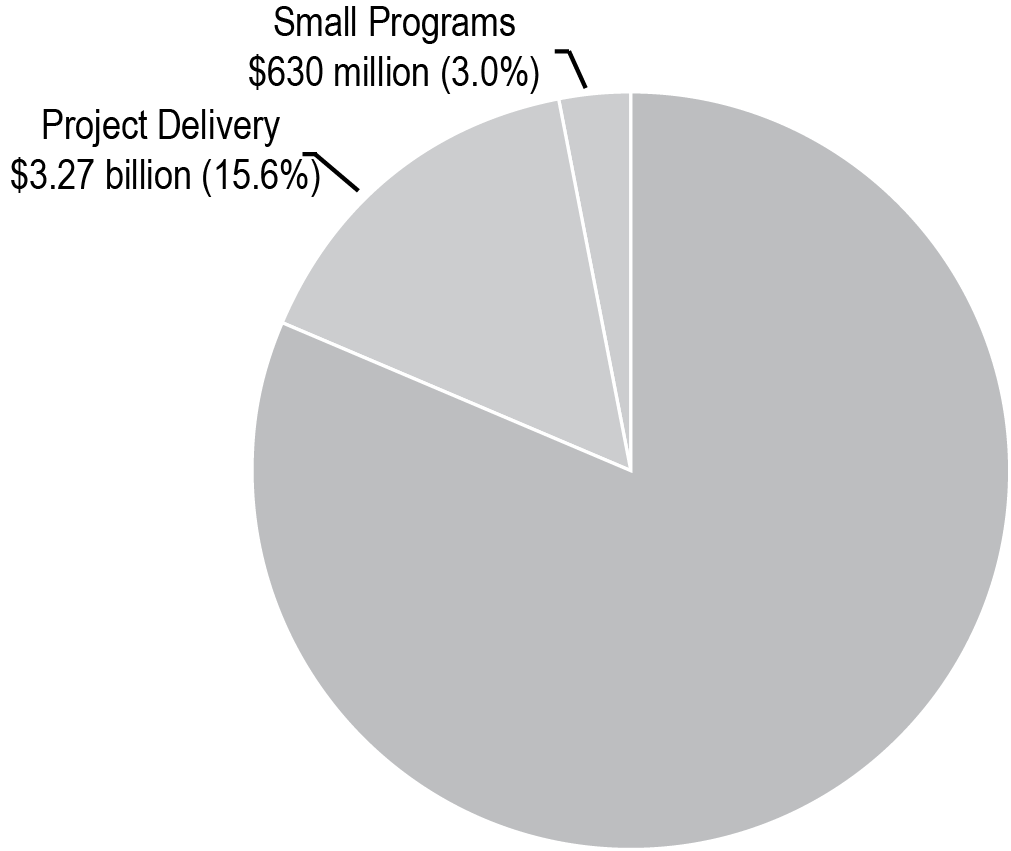
MnDOT anticipates spending approximately 18.6 percent of its program on Small Programs and Project Delivery in all years of the plan (Figure 5-12).
Figure 5-12: Other Investment in MnSHIP
Small Programs
Small Programs is used to fund short-term, unforeseen issues and one-time priorities/needs as they arise. Some programs do not easily fit into a MnSHIP investment category. If funding is required beyond the short-term, an effort is made to incorporate the program into a MnSHIP investment category during the next MnSHIP update.
Components of Small Programs in MnSHIP include centrally managed programs and historic property investments.
Project Selection
The project selection process for Small Programs varies depending on the program. However, projects are typically prioritized and selected centrally instead of at the district level.
Outcomes
MnDOT will invest $630 million in Small Programs through 2037.
Project Delivery
Project Delivery includes components of projects that are critical to ensure the timely and efficient completion of highway projects. These components include right of way costs, consultant services, supplemental agreements and construction incentives (see Chapter 1: Plan Overview for more detail on the components of Project Delivery). Historically, MnDOT has spent an average of 16 percent of total capital revenues on Project Delivery.
Project Selection
Investments in project delivery are the costs associated with delivering projects for the rest of the program. This category does not fund stand-alone projects.
Outcomes
MnDOT assumes that it will continue to spend approximately 16 percent of its funds in this category. This is consistent with recent averages due to the similarity in improvement types scheduled through 2037.
Figure 5-13 summarizes the outcomes related to Other improvements on the state highway system or as part of project delivery based on MnDOT’s investment priorities for MnSHIP and compares them to existing priorities.
Figure 5-13: Other Outcomes and Total Investment
| Investment Category | Objective Area | Current Conditions (2017) | Projected Outcome(s) in 2037 | Total Investment (2018-2037) |
|---|---|---|---|---|
| Project Delivery | Other | Invest the amount necessary to deliver projects in the other categories. | Invest the amount necessary to deliver projects in the other categories. | $3.27 billion |
| Small Programs | Other | - | Continue to invest in small programs such as off-system bridges and historic properties. | $630 million |
| Total | $3.9 B |