
Chapter 9 – Financial Outlook
Transit Funding Sources
Current transportation funding in Greater Minnesota includes federal, state and local funding sources. Eligibility and distribution of these resources are detailed in this chapter.
Federal Funding Sources
The four federal grant sources available to Greater Minnesota transit providers and are described below:
- The Urbanized Area Formula Program (5307)
- Enhanced Mobility for Seniors and Individuals with Disabilities Formula Program (5310)
- Formula Grants for Rural Areas (5311)
- Bus and Bus Facilities Program (5339)
Urbanized Area Formula Program (5307) is available for urbanized areas, which are defined as places with populations greater than 50,000 but less than 200,000. Funding may be used for capital, planning and operations activities. Greater Minnesota has seven urbanized areas eligible to receive funds from this grant program: Fargo-Moorhead, Grand Forks-East Grand Forks, La Crosse-La Crescent, Mankato, Rochester, Duluth-Superior and St. Cloud. These areas receive 5307 grant funds directly from the FTA. For Federal Fiscal Year 2016, Minnesota received $8,667,839 in 5307 grant funding.
Enhanced Mobility of Seniors and Individuals with Disabilities (5310) provides funding for capital and operating assistance to organizations that serve elderly and/or persons with disabilities. Typically MnDOT awards grants from this program for buses or mobility management programs, but other projects are also eligible if they fulfill the program purpose. MnDOT uses 10 percent of the funds for program administration and distributes remaining 5310 funds to selected awardees statewide. Awardees may include tribal governments, state and local governments, private nonprofit organizations, public transportation operators and private operators of public transportation services. For Federal Fiscal Year 2016, the amount of Section 5310 funds appropriated to Minnesota were:
- Urbanized systems: $1,936,203
- Small urban systems: $615,573
- Rural systems: $1,215,679
Since MnDOT is a direct recipient of 5310 grant funding, it selects sub recipients through an application process before entering into a contract with the selected grant awardees.
Formula Grants for Rural Areas (5311) are available for rural and small urban areas (places with populations less than 50,000). In Federal Fiscal Year 2016, $15,673,443 was available for capital and operating assistance, of which 15 percent or $2,351,016 went to intercity bus under section 5311(f) and 10 percent is used by MnDOT for program administration.
In addition, $244,630 5311(b)(3) funds were appropriated to research, training and technical assistance for transit operators in non-urbanized areas under the Rural Transit Assistance Program (RTAP).
Six registered tribes in Minnesota received $2,313,787 in 5311(c) funds for capital and operating costs directly from FTA in Federal Fiscal Year 2016.
Other than 5311(c) funds, States are the direct recipients of 5311 grant funds from the FTA. States distribute these funds to sub recipients. Subrecipients may include a local governmental authority, a nonprofit organization, a tribe or an operator of public transportation or intercity bus service. Since MnDOT is a direct recipient of 5311 grant funding, it selects sub recipients through an application process before entering into a contract with the selected grant awardees. The Boise Forte, Fond du Lac and White Earth tribes have chosen to receive funds through MnDOT’s distribution of statewide Section 5311 appropriation directly from FTA. Red Lake has chosen to receive funds through distribution from MnDOT.
Bus and Bus Facilities Program (5339) provides funding to assist in the procurement of vehicles or the construction of facilities. MnDOT is responsible for distributing these funds to Greater Minnesota transit providers. The funds can only be used for capital investments (replacing, rehabilitating, purchasing buses and bus-related equipment and constructing bus-related facilities). For Federal Fiscal Year 2016, Minnesota received a total of $635,929 for Greater Minnesota urbanized areas and $1.75 million in national distribution funds that can be granted to rural or small urban public transit operators.
State Funding Sources
- The Minnesota Legislature appropriates transit funding from the General Fund on a biennial basis. The legislature also statutorily sets the percentage of Motor Vehicle Sales Tax (MVST) revenue dedicated to public transit at 40 percent:
- Greater Minnesota Transit Account receives 4 percent
- Metropolitan Area Transit Account receives 36 percent
- The Highway User Tax Distribution Fund requires 60 percent
In addition, Greater Minnesota transit receives 50 percent of Motor Vehicle Lease Sales Tax (MVLST) revenue collected beyond the first $32 million, which goes to the State’s General Fund.The MVST and MVLST are deposited in the Greater Minnesota Transit Account.
Figure 9-1 summarizes Calendar Year 2015 operating budget for Greater Minnesota Transit providers using the different funding sources.
Figure 9-1. Calendar Year 2015 Operating Budget for Greater Minnesota Transit
| Peer Group | Federal (5307 and 5311) | State General Fund | GMTA | Local Share | Total |
| Urbanized | $3,500,637 | $10,278,400 | $8,247,601 | $8,612,455 | $30,689,094 |
| ADA-Complementary Paratransit | $0 | $2,458,625 | $2,354,347 | $1,285,124 | $6,098,096 |
| Small Urban | $766,372 | $470,505 | $443,827 | $453,809 | $2,134,513 |
| Rural | $13,204,355 | $6,822,135 | $11,240,172 | $6,600,598 | $37,927,260 |
| Transit For Our Future | $0 | $0 | $399,994 | $70,587 | $470,581 |
| Other Transit Services | $0 | $0 | $1,277,145 | $505,557 | $1,782,702 |
| Total | $17,521,364 | $20,089,665 | $23,963,086 | $17,528,130 | $79,102,247 |
* Motor Vehicle Sales Tax (also includes MVLST) Source: 2015 MnDOT Transit Report
MnDOT annually distributes state funds to Greater Minnesota transit through the Public Transit Participation Program. These funds are used for operating, capital and planning activities. Any of the following organizations—or combination of the following— are eligible to receive state funding:
- Any legislatively established public transit commission or authority
- Any county or any statutory or home rule charter city providing financial assistance to or operating public transit
- Any private operator of public transit
Local Funding Sources
Minnesota state law requires local funding participation from public transit services that receive federal and state funding. As shown in Figure 9-2, a fixed share funding formula sets a required local share of the transit operating costs. Local share is dependent on the peer group classification of the service.
Figure 9-2. Federal, State, and Local Share Funding Requirements
| Peer Group | Federal and State Share | Local Share Requirement |
| Rural (population less than 2,500) | 85% | 15% |
| Urbanized (population more than 50,000) | 80% | 20% |
| Elderly and disabled (ADA paratransit) | 85% | 15% |
| Small urban (population 2,500 - 50,000) | 80% | 20% |
Source: Minnesota Statute 174.28, subd 3b.
Fare and contract revenues sometimes achieve the local share required to leverage the federal and state share.
- Fare Revenue. Funding provided directly from cash fares, pre-paid tickets or sales of passes to individuals.
- Contract Revenue. Funding provided by organizations for the transport of their clients. An example is the transport of Day Training and Habilitation clients. Revenue is also generated from advertising and other contracts.
In some communities local funds are provided to “close the gap” where insufficient fare and contract revenues are collected. Figure 9-3 summarizes the local share of operating costs over a six-year period.
Figure 9-3. Greater Minnesota Public Transit Annual Local Share, CY 2010-2015
| Peer Group | 2010 | 2011 | 2012 | 2013 | 2014 | 2015 |
| Urbanized* | $7,281,909 | $8,496,173 | $10,332,687 | $9,773,268 | $9,545,032 | $8,612,455 |
| ADA-Complementary Paratransit | $1,728,114 | $1,850,106 | $1,812,382 | $1,624,061 | $1,391,083 | $1,285,124 |
| Small | $1,122,970 | $1,264,521 | $1,199,668 | $684,847 | $509,253 | $453,809 |
| Rural | $6,801,836 | $7,012,690 | $7,514,682 | $7,048,246 | $7,544,224 | $6,600,598 |
| Transit For Our Future | -- | -- | -- | $44,029 | $65,192 | $70,587 |
| Other Transit Services | -- | -- | -- | $247,887 | $210,332 | $505,557 |
| Greater Minnesota | $16,987,395 | $18,623,491 | $20,859,419 | $19,464,520 | $19,265,116 | $17,528,130 |
*Greater Mankato Transit System, previously a small urban system, was reclassified as an urbanized system in 2013
Source: MnDOT Transit Report, 2011-2016
Annual Operating Costs
Figure 9-4 shows the annual operating costs for Greater Minnesota transit systems by peer group. Overall transit operating costs in Greater Minnesota increased by 35 percent (over $20 million) during the five-year period. During this time, hours of service and ridership increased by 14.2 and 9.6 percent, respectively, while inflation accounted for much of the remainder. The significant decrease in small urban costs and increase in rural and urbanized costs is due to the reclassification of Mankato from a small urban to an urbanized system in 2013, and some small urban systems merging with rural systems.
Figure 9-4. Greater Minnesota Public Transit Annual Operating Costs, 2010-2015
| PEER GROUP | 2010 | 2011 | 2012 | 2013 | 2014 | 2015 | PERCENT CHANGE (2010–2015) |
| Urbanized* | $22,899,589 | $24,923,373 | $26,830,387 | $28,737,075 | $30,219,815 | $30,689,094 | 34.0% |
| ADA-Complementary Paratransit | $4,475,654 | $4,739,045 | $4,702,382 | $4,730,007 | $5,281,240 | $6,098,096 | 36.3% |
| Small Urban* | $4,317,571 | $4,549,283 | $3,904,818 | $2,565,824 | $2,238,184 | $2,134,513 | -50.6% |
| Rural | $26,830,569 | $28,207,803 | $28,596,297 | $31,233,351 | $35,761,854 | $37,927,260 | 41.4% |
| Transit For Our Future | -- | -- | -- | $278,798 | $784,613 | $470,581 | -- |
| Other Transit Services | -- | -- | -- | $436,711 | $465,532 | $1,782,702 | -- |
| Greater Minnesota | $58,523,383 | $62,419,504 | $64,033,884 | $68,261,171 | $74,751,238 | $79,102,247 | 35.2% |
*Greater Mankato Transit was reclassified from a small urban to an urbanized system in 2013
Source: MnDOT Transit Report, 2011-2016
Operating Costs for Service Improvements
The goal of this plan is for transit systems to add service in the communities they serve if they are not providing a span of service that meets or exceeds the baseline described in Chapter 6, as long as revenue sources remain secure and ridership supports such services. Other additional services are also proposed in order to achieve the goal of meeting 90 percent of need by 2025. The cost of those additional hours have been estimated below using the average cost per hour for each peer group (Urban, ADA Paratransit, Small Urban, Rural and Express) from 2015 increased by 3 percent per year to illustrate the cost of additional service in 2017 dollars ($) in Figure 9-5. These costs are fully allocated, meaning that administrative costs for extended dispatching, customer service, maintenance, etc. are included. It is important to note that this service would be added incrementally from now until 2025 to achieve the goal of meeting 90 percent of need by 2025.
The total cost of operating public transit in Greater Minnesota in 2015 was $79 million as shown in Figure 9-1. Meeting this plan means adding about 509,000 annual service hours at an additional annual operating cost (in 2017 $) of $35.7 million. This represents a 51 percent increase in operating costs over existing expenditures.
The current overall local share requirement is approximately $17.5 million; the expanded services would increase the local share requirement by approximately $6.3 million.
Figure 9‑5: Service Improvements: Supplemental Operating Costs in 2017 dollars
| SERVICE IMPROVEMENTS | PEER GROUP | DESCRIPTION | 2025 GOAL | OPERATING COST1 | LOCAL SHARE |
| Urban Areas Weekday2 | Urban | 20 hours/day | 54,750 | $5,109,000 | $1,021,800 |
| Urban Areas Saturday2 | Urban | 12 hours/day | 4,950 | $462,000 | $92,400 |
| Urban Areas Sunday2 | Urban | 9 hours/day | 13,500 | $1,260,000 | $252,000 |
| Cities 7,000-49,999 Weekday | Small Urban | 12 hours/day | 31,635 | $1,267,000 | $253,400 |
| Rural | 63,270 | $3,723,000 | $558,450 | ||
| Cities 2,500-6,999 Weekday | Small Urban | 9 hours/day | 10,123 | $405,000 | $81,000 |
| Rural | 21,512 | $1,266,000 | $189,900 | ||
| Cities 2,500-49,999 Saturday | Small Urban | 9 hours/day | 13,273 | $531,000 | $106,200 |
| Rural | 26,949 | $1,586,000 | $237,900 | ||
| Cities 7,000-49,999 Sunday | Small Urban | 9 hours/day | 6,021 | $241,000 | $48,200 |
| Rural | 12,224 | $719,000 | $107,850 | ||
| County Seat Towns < 2,500 | Small Urban | 8 hours/day; 3 days/week | 6,324 | $253,000 | $50,600 |
| Rural | 12,839 | $755,000 | $113,250 | ||
| ADA Complementary Paratransit | Elderly & Disabled | Service to support fixed route improvements | 104,832 | $6,780,000 | $1,017,000 |
| Unserved Urban Areas | Urban | Improve urban transit service coverage | 31,632 | $2,952,000 | $590,400 |
| Peak Period Frequency | Urban | Provide 30-minute peak period frequency | 33,133 | $3,092,000 | $618,400 |
| Regional Express | Express | Six routes3 | 30,000 | $3,372,000 | $674,400 |
| Regional Mobility | Rural | Routes operating a minimum of 2 days/week connecting communities for shopping and medical4 | 32,000 | $1,883,000 | $282,450 |
| Total Service Improvements | 508,967 | $35,656,000 | $6,295,600 |
1 Based on average hourly operating costs by peer group (Urban, Elderly & Disabled, Small Urban, Rural and Express) in 2015 and escalated to 2017 dollars. Peer groups are also referred to as recipient classifications in Minnesota Statutes 174.24, subd. 3b.
2 Additional hours of service needed for urban improvements were identified by the urban transit providers as part of the planning process
3 Northstar Link-type services to urban areas over 50,000 population
4 40 counties x 8 hrs/day x 50 weeks. Assumes half of counties already have mobility routes
Capital Costs
In many communities, additional service will also require capital purchases. These costs are shown in Figure 9-6. A total of 210 additional buses are projected to be needed for service improvements between now and 2025. These buses will cost approximately $45.5 million in 2017 dollars (local share is $9.1 million). The annual cost of replacement buses for the existing fleet, plus supplemental buses added over time for the service improvements, will increase from $12.9 million in 2016 to $21.8 million in 2025.
The 210 vehicles is the total number to implement the full service improvements. Since service will be added incrementally, capital will be purchased as needed over the next several years.
Figure 9‑6: Service Improvements: Supplemental Capital Costs in 2017 dollars
| BASELINE SERVICE IMPROVEMENTS | FLEET SUPPLEMENT REQUIRED | SUPPLEMENTAL CAPITAL COST ESTIMATE1 | LOCAL SHARE 20% |
| Urbanized 50,000+ | 60 | $28,200,000 | $5,640,000 |
| Small Urban 2,500 - 49,999 | 140 | $10,640,000 | $2,128,000 |
| Express | 10 | $6,700,000 | $1,340,000 |
| Total Service Improvements | 210 | $45,540,000 | $9,108,000 |
| 1 Estimated vehicle costs in 2017 dollars: Urban - $470,000 (Class 700 Diesel); ADA Paratransit, Small Urban & Rural - $76,000 (Class 400 Diesel); Express - $670,000 (Motorcoach) | |||
Cost of Meeting 100% of Transit Demand
Minnesota statute 174.24 directs MnDOT to “identify of the operating and capital costs necessary to meet 100 percent of the greater Minnesota transit targeted and projected bus service hours for 2020, 2025 and 2030”. The 2014 Greater Minnesota Transit Need Model calculated the total greater Minnesota trip need for 2020, 2025 and 2030 (Figure 9-7).
Figure 9‑7: Transit Need Projections
| Year | 100% of Demand (trips) |
| 2015 | 12.1 million |
| 2020 | 16.9 million |
| 2025 | 18.9 million |
| 2030 | 20.1 million |
MnDOT used a mathematical formula to calculate the number of service hours needed to meet 100 percent of need. The number of service hours is equal to the ridership target divided by average productivity in 2015 (9.9 passengers per hour). The service hours projected from the current year to 2030 are listed in Figure 9-8. The cost per hour is indexed at 3 percent per year for inflation. The local share is 20 percent for urban, small urban and express systems and 15 percent for rural and elderly & disabled (complementary ADA paratransit).
Figure 9‑8: Operating Costs to meet 100% of Need
CALENDAR YEAR | 100% OF TRANSIT NEED (TRIPS) | SERVICE | TOTAL OPERATING COSTS | LOCAL SHARE | LOCAL SHARE | LOCAL SHARE | LOCAL SHARE | LOCAL SHARE |
2016 | 14,500,000 | 1,465,000 | $98,492,000 | $7,780,000 | $1,155,000 | $544,000 | $7,264,000 | $147,000 |
2020 | 16,900,000 | 1,707,000 | $132,588,000 | $10,339,000 | $1,515,000 | $740,000 | $9,911,000 | $193,000 |
2025 | 18,900,000 | 1,909,000 | $170,912,000 | $13,365,000 | $1,964,000 | $952,000 | $12,739,000 | $250,000 |
2030 | 20,100,000 | 2,030,000 | $210,349,000 | $16,462,000 | $2,421,000 | $1,171,000 | $15,665,000 | $308,000 |
Meeting 100% of transit need will require capital investments. Figure 9-9 shows the replacement costs for the existing fleet during each five-year period from 2016-2030. It does not include the vehicles needed for the service expansion. Figure 9-10 shows the additional number of vehicles needed to add service to meet 100 percent of need per five-year period. A standard of one vehicle for every 2,500 hours of service was used in this calculation. The local share for capital is 20 percent as called for in Minnesota Rules 8835.0320. Buses were grouped into Large (class 600 and 700) and Small (class 300, 400 and 500) with the class 700 and 400 bus prices in 2015 being used for the Large and Small estimated cost, respectively, and inflated by 3 percent per year.
Figure 9‑9: Replacement Capital Costs to Meet 100% of Need
| CALENDAR YEARS | TOTAL REPLACEMENT COST (MILLIONS) | LOCAL SHARE (20%) (MILLIONS) |
| 2016 - 2020 | $81.28 | $16.26 |
| 2021 - 2025 | $107.08 | $21.42 |
| 2026 - 2030 | $135.01 | $27.00 |
| Total | $323.37 | $64.67 |
Figure 9:10: Expansion Capital Cost to Meet 100% of Need
CALENDAR YEARS | LARGE BUSES | TOTAL URBAN CAPITAL COST (MILLIONS) | URBAN LOCAL SHARE (20%) (MILLIONS) | SMALL BUSES | TOTAL SMALL BUS CAPITAL COST (MILLIONS) | SMALL BUS LOCAL SHARE (20%) (MILLIONS) |
2016-2020 | 65 | $32.78 | $6.56 | 130 | $9.94 | $1.99 |
2021-2025 | 25 | $15.24 | $3.05 | 55 | $4.95 | $0.99 |
2025- 2030 | 20 | $14.40 | $2.88 | 31 | $3.25 | $0.65 |
Total | 110 | $62.42 | $12.48 | 216 | $18.14 | $3.63 |
Planned Growth Investment Scenarios
Operating Cost Projections
To guide potential investment strategies for future services and to better understand the size of the investment gap between current transit services and projected need, MnDOT developed a service plan to meet future transit need in Greater Minnesota. The components of the service plan are described in Chapter 6 and based on input received during the outreach phase of this plan. The primary inputs for the cost model are the future service need estimates (service hours) developed as part of the service plan and current operating expenses per service hour. To develop the cost estimates, an average expense per hour rate for each peer group of transit systems was applied to the future service plan and adjusted for inflation, assuming costs increase at 3.1 percent per year.
The number of hours charted in Figure 9-11 and listed in Figure 9-12 depicts the number of hours to implement all service including expansion. The hours are incrementally ramped up by approximately 51,000 hours each year. Of the total 51,000 additional hours each year, approximately 13,800 will be added to urbanized fixed route systems, 10,500 to ADA Complementary Paratransit in urbanized areas, 3,000 to express routes serving urbanized areas, and 23,600 to small urban and rural transit systems combined.
Figure 9‑11: Hours of Service to Achieve Goal of Meeting 90% of Need by 2025 and Hold There
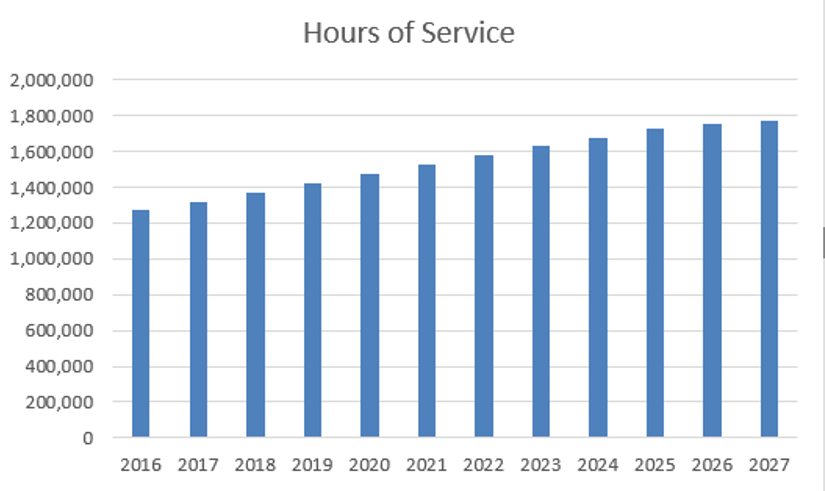
Figure 9-12: Total Operating Cost for All Service, Including Service Improvments to Meet 90% of Need by 2024
| CALENDAR YEAR | SERVICE | TOTAL OPERATING COSTS | LOCAL SHARE | LOCAL SHARE | LOCAL SHARE | LOCAL SHARE | LOCAL SHARE |
| 2016 | 1,269,000 | $85,248,000 | $6,614,000 | $981,000 | $466,000 | $6,403,000 | $125,000 |
| 2017 | 1,319,000 | $91,582,000 | $7,093,000 | $1,050,000 | $502,000 | $6,890,000 | $134,000 |
| 2018 | 1,369,000 | $99,643,000 | $7,653,000 | $1,123,000 | $554,000 | $7,562,000 | $143,000 |
| 2019 | 1,419,000 | $106,268,000 | $8,166,000 | $1,199,000 | $590,000 | $8,060,000 | $153,000 |
| 2020 | 1,469,000 | $113,201,000 | $8,703,000 | $1,278,000 | $628,000 | $8,582,000 | $163,000 |
| 2021 | 1,519,000 | $120,455,000 | $9,264,000 | $1,361,000 | $668,000 | $9,128,000 | $173,000 |
| 2022 | 1,569,000 | $128,043,000 | $9,852,000 | $1,448,000 | $709,000 | $9,699,000 | $184,000 |
| 2023 | 1,619,000 | $135,977,000 | $10,466,000 | $1,539,000 | $753,000 | $10,296,000 | $196,000 |
| 2024 | 1,669,000 | $144,272,000 | $11,109,000 | $1,634,000 | $798,000 | $10,920,000 | $208,000 |
| 2025 | 1,718,000 | $152,856,000 | $11,774,000 | $1,733,000 | $845,000 | $11,566,000 | $221,000 |
The annual operating cost is based on the 2015 average peer group transit system average costs of $87.96 per service hour for urbanized systems, $60.96 for ADA Complementary Paratransit (elderly & disabled), $37.74 for small urban, $55.46 for rural and $105.95 for express, inflated with a 3.1 percent annual increase. The 51,000 additional hours will provide service needed to increase ridership to meet the 90 percent of need target by 2025.
Projected Revenue
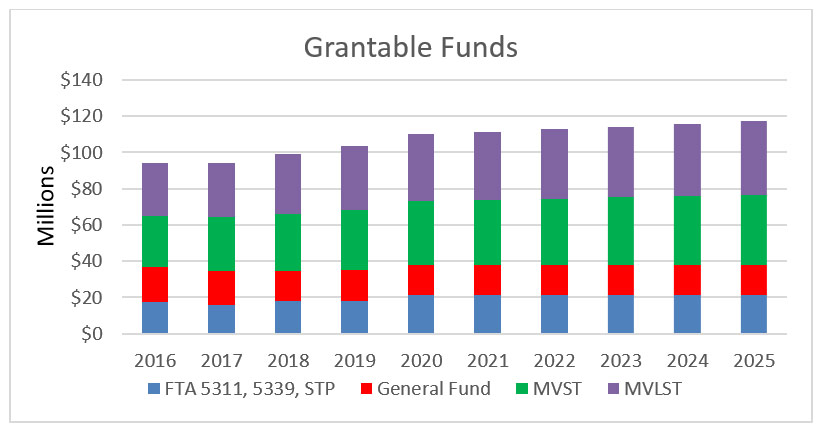
Figure 9-13 shows that grantable transit revenue sources are expected to generally remain stable until 2025 with a slightly higher growth rate before 2020 than after. The State General Fund is assumed to remain at the current legislatively defined baseline amount. State sales tax values for 2017-2021 are from the November 2016 Minnesota Management and Budget forecast. Beyond that, they are assumed to grow at the rate of the Consumer Price Index forecast for Heavy Duty Truck Manufacturing from the Bureau of Labor Statistics. FTA appropriations are assumed to grow at a 2 percent rate through the life of the Fixing America’s Surface Transportation Act (FAST-Act) and stay flat beyond.
Figure 9-13: Greater Minnesota Funding Sources
Funding Gap
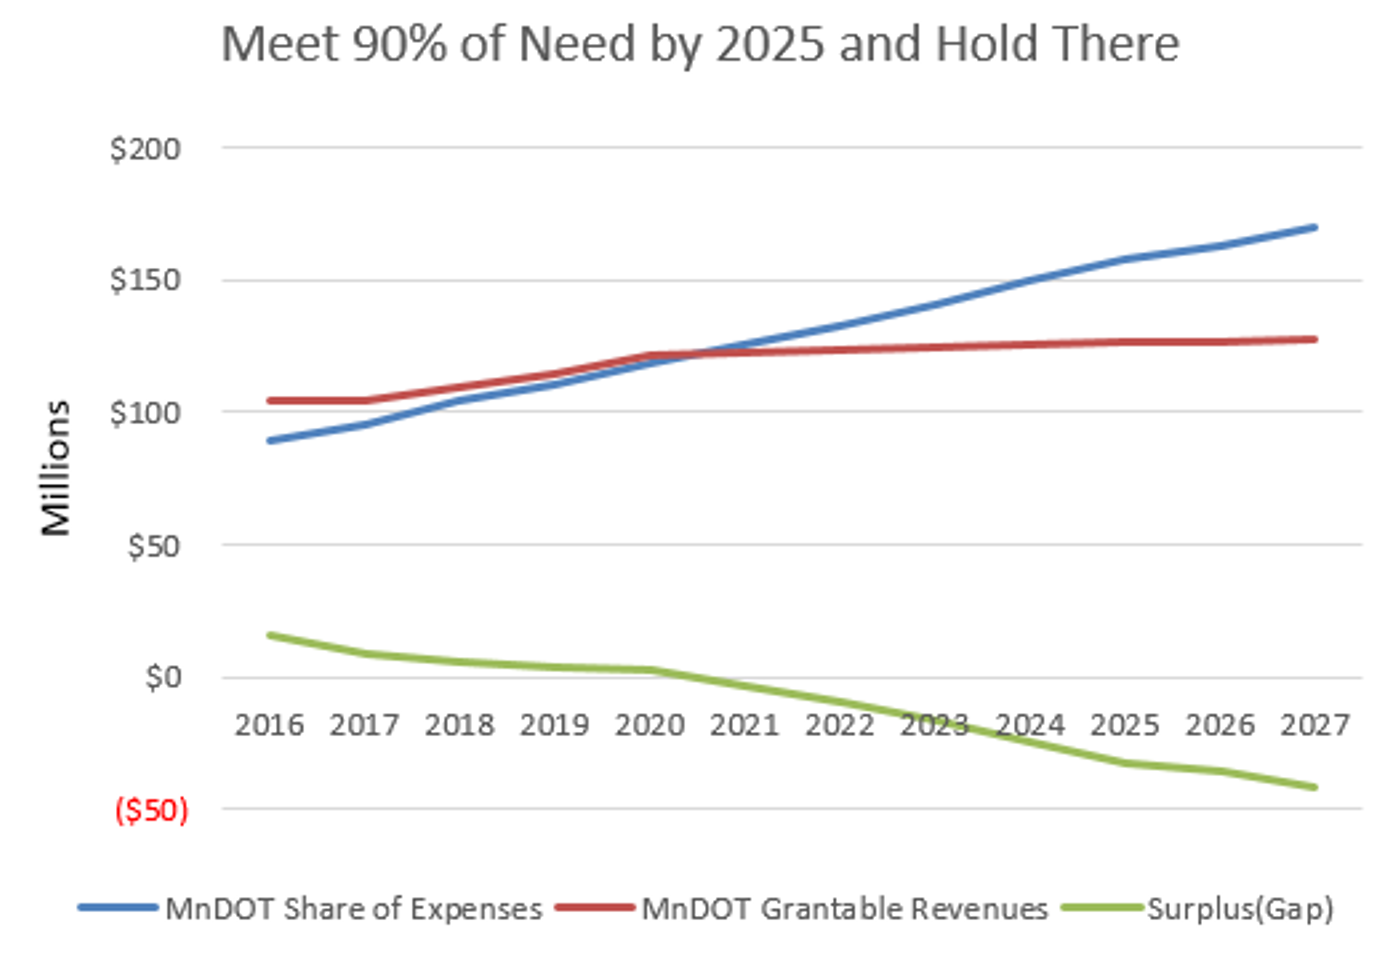
With the planned expansions to achieve the goal of meeting 90 percent of need by 2025, expenses will start to exceed revenues in 2021 (Figure 9-14). By 2025, the annual deficit between revenues and expenses will climb to about $31 million. It will increase by about $5 million per year.
Figure 9-14. Program Revenues, Expenses and Cost Gap
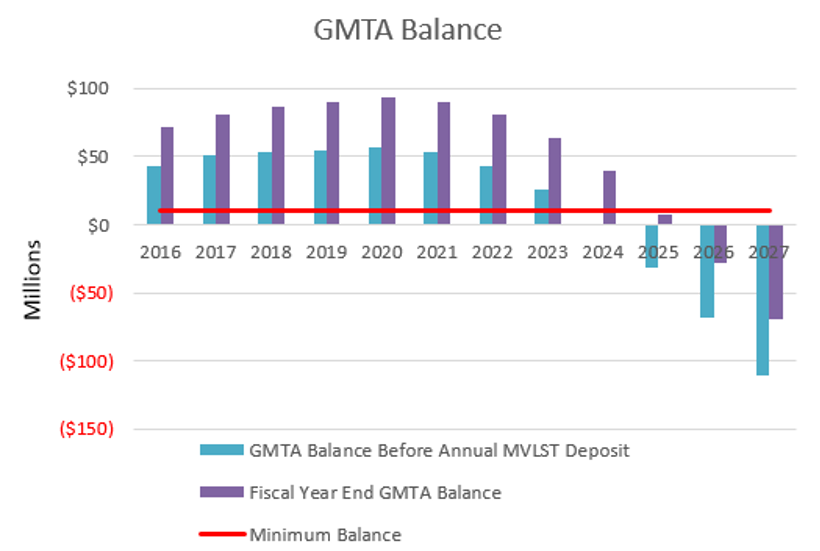
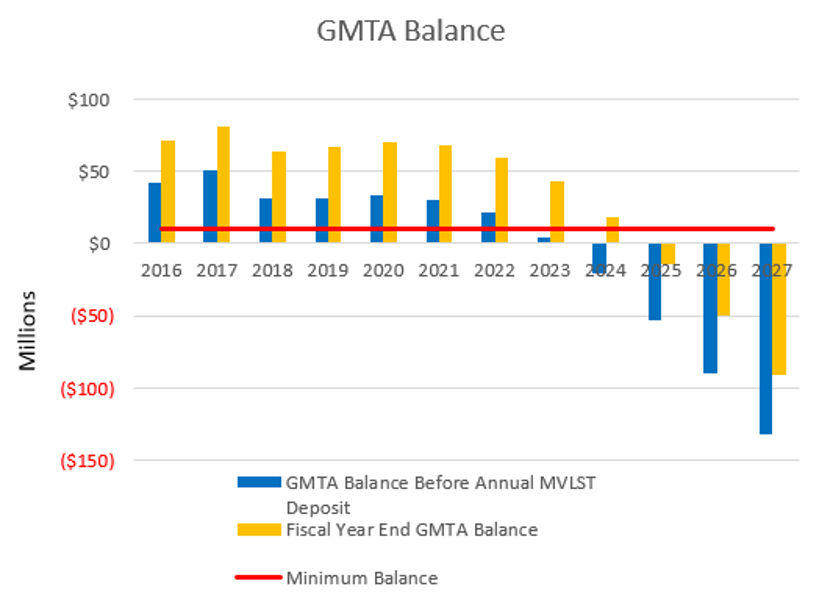
Greater Minnesota transit is fortunate to have an existing balance in the Greater Minnesota Transit Account (GMTA). Figure 9-15 illustrates the balance. Each year shows to bars reflecting the balance before and after the annual MVLST deposit is made. The green bar depicts the GMTA balance after the books are closed after a fiscal year. The red bar depicts the GMTA balance just before that year’s MVLST revenues are deposited. That deposit happens at the end of the fiscal year. As shown in Figure 9-15, by 2024, the positive balance in the GMTA will be exhausted and additional funding will be needed from that year forward to continue to meet 90 percent of the transit need. MnDOT strives to keep a $10 million balance in the GMTA so it can help transit systems in emergencies as well as to whether lower than expected revenues. To achieve the goal by 2025 and hold there through 2027 (in other words, the next ten-year period of 2018 through 2027) will require approximately $120 million of additional revenue. This is based on the $110 million deficit shown by the red bar in 2027 plus the $10 million minimum balance MnDOT strives to maintain.
Figure 9-15: Greater Minnesota Transit Account Balance
Other Investment Scenarios
The previous discussion outlined the planned growth investment scenario to achieve the legislative goal of meeting 90 percent of need by 2025 and holding there. However, this plan must also establish investment strategies that correspond to other funding scenarios. This must start with the priorities established in Minnesota Rules § 8835.0270, Subpart 1:
“Allocation Priorities: The department shall allocate financial assistance to recipients for purposes of the public transit participation program according to the following order of priority:
- Operating costs for existing public transit systems;
- Capital costs for existing public transit systems; and
- Operating and capital costs for the provision of public transit services in a community or area not currently served by public transit.”
MnDOT’s approach to increased or decreased funding scenarios was further developed in the 2011 Greater Minnesota Transit Investment Plan and is illustrated in Figure 9-16.
Figure 9-16. Investment Scenarios
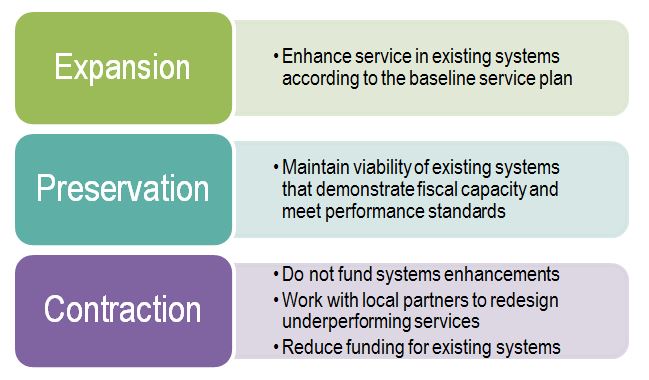
MnDOT’s first priority for Greater Minnesota transit is to fund each system at a level sufficient to sustain the current level of service and add additional hours to reach the baseline span of service. Greater Minnesota transit is fortunate to currently have the resources to start on a path of expansion. However, financial conditions could change over time such that a transition to a preservation or contraction investment scenario would be required. If there weren’t enough funds to sustain a level of service, MnDOT would depend on local transit providers to prioritize their services and, if necessary, eliminate the lowest.
The scenarios that follow comply with the above investment scenario model. The fiscally constrained scenario expands service according to the baseline plan until the expected revenues can no longer support expansion. Then it preserves that level of service through the remainder of the 2018 to 2027 period. The pilot program scenarios accelerate the expansion earlier to provide mobility benefits to the citizens of Greater Minnesota longer. They both reach a point where expected revenues are exhausted and would either need an injection of more revenue or a transition to the contraction funding scenario in the later years.
Fiscally Constrained Scenario
As noted above, additional revenues beyond those currently expected will be needed to achieve the goal of this plan. This section is intended to describe what would happen if those additional funds are not available—a fiscally constrained scenario.
There are many different ways one can define a fiscally constrained scenario. For this plan, the fiscally constrained scenario reviewed how close Greater Minnesota transit service could come to the legislative goal of achieving 90 percent of need and maintaining that level of service through 2027. If no additional funds are provided, Greater Minnesota transit could meet 86 percent of the hours of service need through 2020 (Figure 9-17). By 2027, Greater Minnesota transit would only meet 75 percent of the need. The hours of service that would be delivered are illustrated in Figure 9-17.
Figure 9-17: Fiscally Constrained Hours of Service
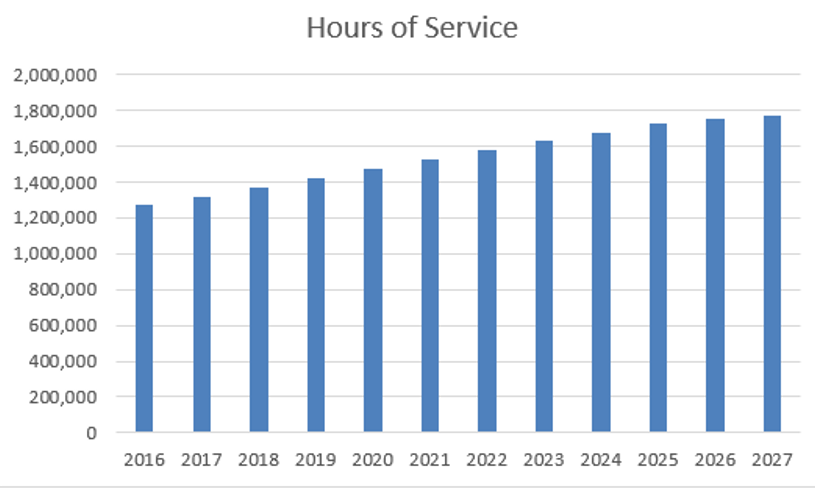
The level of need that would be met in this scenario is 86 percent through 2020, and then decreases to 75 percent in 2027.
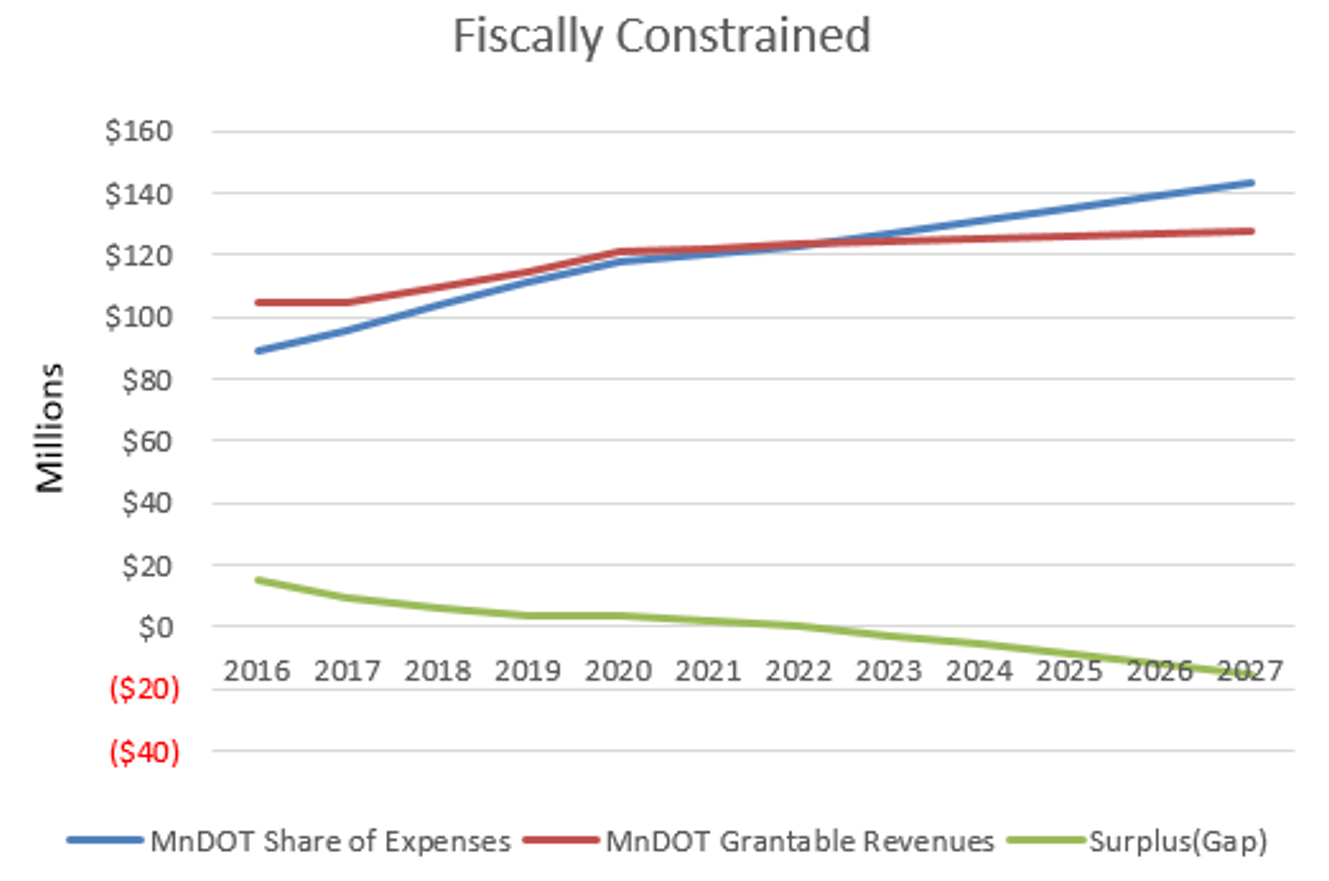
This scenario delays the point at which expenses exceed revenues to 2023. As shown in Figure 9-18, the deficit by 2027 is approaching $16 million and growing by about $3.5 million per year. To maintain the same hours of service in 2028 as shown for 2027 would require an additional $19 million in funding beyond those currently expected.
Figure 9-18: Program Revenues, Fiscally Constrained Expenses and Cost Gap
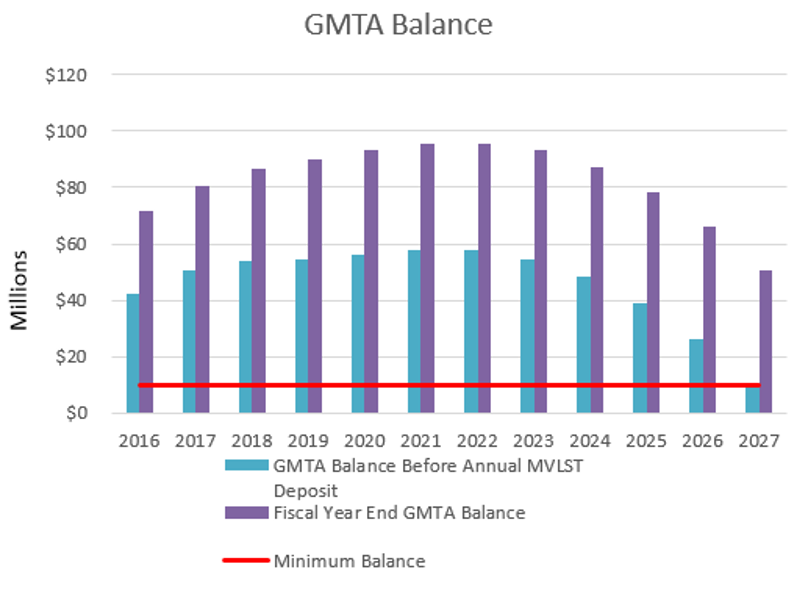
As shown in Figure 9-19, under this scenario, the GMTA balance grows slightly higher than under the fiscally constrained scenario of achieving the goal of meeting 90 percent of need by 2025. It also remains at a high level longer because this scenario depends on using the balance to sustain hours of service longer into the future.
Figure 9-19: Fiscally Constrained Greater Minnesota Transit Account Balance
Pilot Program Scenarios
As this investment plan was being completed, MnDOT was launching a discretionary grant pilot program to encourage earlier service expansion. Knowing that a lack of local funds to fulfill match requirements was slowing expansion, this program offers an opportunity for grants for up to two years for service expansion and improvements and associated capital investments with no local match requirement (allowed under Minnesota Statutes 174.24, subd 3b (e)). Capital grants will be 100 percent state funds and operating grants will cover the entire operating deficit.
MnDOT estimates that this pilot program will result in 50,000 (lower growth) to 100,000 (higher growth) additional hours of service. Some could start before the end of calendar year 2017, but most will start in 2018 and some requiring new buses with a long lead time might not start until later.
Charts depicting service hours, expenses versus revenues, and impact on the GMTA balance for each pilot program scenario follow in Figures 9-20 through 9-25. As one would expect, the earlier spending in these scenarios bring the time at which more funding is needed earlier.
Figure 9-20: Pilot Program with Lower Growth Hours of Service
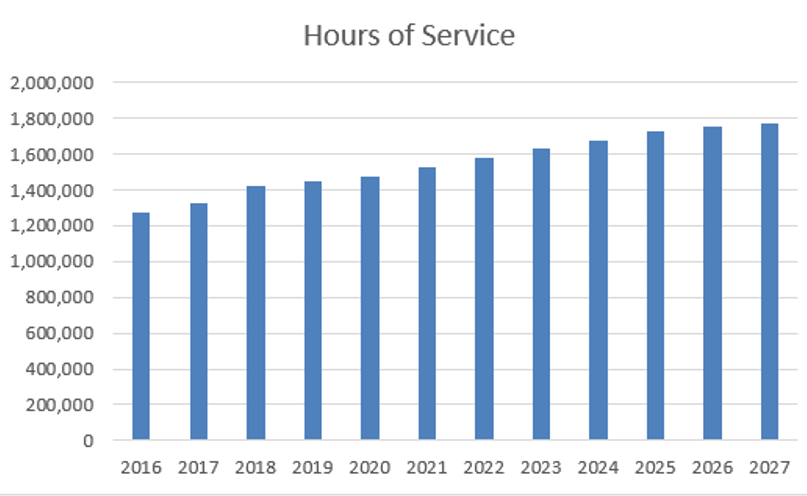
Figure 9-21: Pilot Program with Lower Growth Revenues, Expenses and Cost Gap
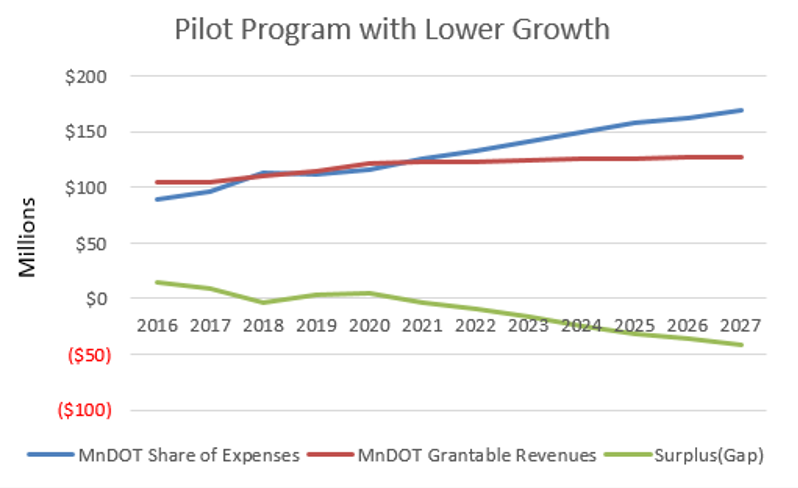
Figure 9-22: Pilot Program with Lower Growth Greater Minnesota Transit Account Balance
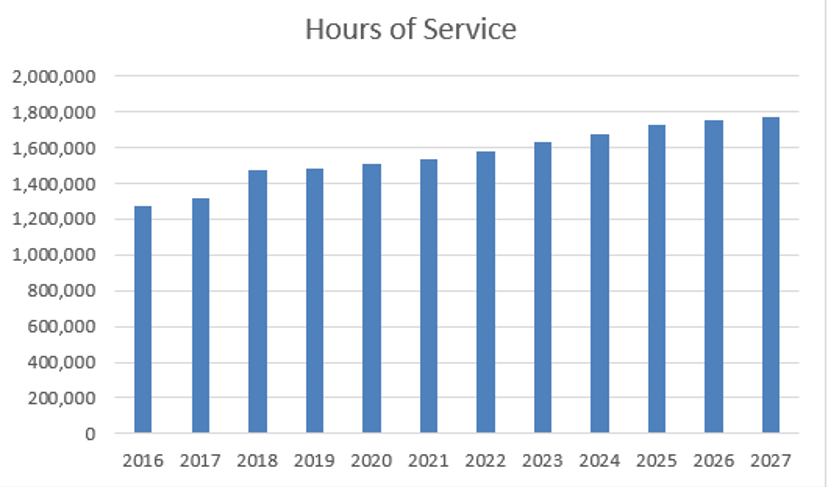
Figure 9-23: Pilot Program with Higher Growth Hours of Service
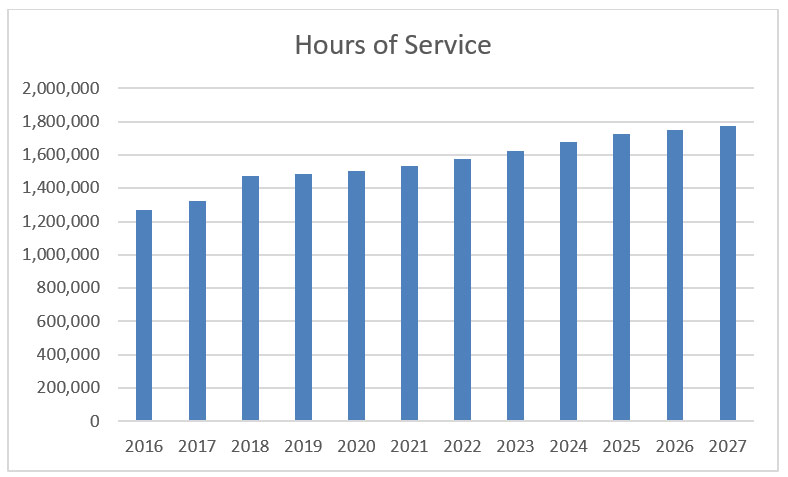
Figure 9-24: Pilot Program with Higher Growth Revenues, Expenses and Cost Gap
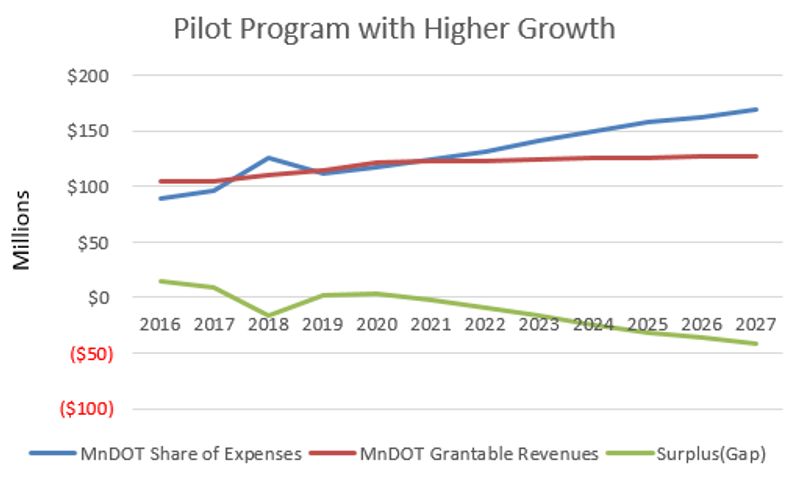
Figure 9-25: Pilot Program with Lower Growth Greater Minnesota Transit Account Balance
Conclusion
Greater Minnesota transit is well situated to continue striving for the goal of meeting 90 percent of need by 2025 and into the future. This Plan describes the service expansion necessary to meet that goal and describes how currently anticipated funding will fall short by $120 million over the 2018 to 2027 period. Governor Dayton released his transportation funding proposal just before this Plan was completed. It calls for providing that additional $120 million to Greater Minnesota transit from the General Fund over the 2018 to 2025 period.