
Chapter 5 – Community Input
Public transportation serves the public. Gathering input from existing and potential riders ensures that transit meets what the community wants. Understanding customer expectations and creating service to match those needs will increase ridership. Outreach to gather input from existing and potential riders was comprehensive and took several forms and totaled 6,378 responses (Figure 5‑1). (View the full Public Participation Plan):
- On-Board survey with existing transit riders (full report available with Technical Memo: Transit Users Preferences and Travel Patterns)
- Online survey gathering priorities for transit and travel behavior (full report available with the Technical Memo: Non-User Service Priorities)
- Origin and destination survey to understand common trip patterns (full report available in Technical Memo: Existing and Desired Travel Patterns)
- “Hard to Reach” survey targeted at traditionally under-represented demographics or communities (full report available in Technical Memo: Hard to Reach Population Survey)
- Tribal outreach including in-person meetings with three tribes and a participatory mapping exercise.
Figure 5-1 - Summary of Outreach Participants
| Survey Instrument | Total Responses |
| Onboard Survey | 5,297 |
| Online Community Survey | 341 |
| Wikimapping Tool | 341 |
| Hard to Reach Population Survey | 399 |
| Total | 6,378 |
On-Board Transit Rider Survey
MnDOT distributed surveys to transit providers operating across Greater Minnesota. The surveys were administered on board transit vehicles to users of more than 40 systems across the state from rural dial-a-ride services to large fixed-route systems in urbanized cities.. Riders responded to questions related to transit use, including mode of access, frequency of use, trip purpose and desired improvements. Surveys were distributed during one calendar week, with most systems conducting their surveys during the week of Nov. 2, 2015. Participants were assisted in a variety of ways including: bus drivers helping to fill out forms for those requiring help writing, working with caretakers to facilitate completion in group homes, and sending forms home with children to receive help from a parent or guardian. In total 5,297 valid surveys were collected: 5,258 in English, 25 in Spanish, 11 in Somali, and 3 in Hmong. To assess the results in the context of the plan, survey responses were grouped into the three population designations used to allocate transit funding (see Figure 5-2).
Figure 5-2 - Transit System Types
| System Type | Primary Population Center Population | Typical Service Types |
| Rural | Less than 2,500 | Dial-a-ride |
| Small Urban | 2,500–50,000 | Dial-a-ride, deviated route |
| Urban | More than 50,000 | Dial-a-ride, fixed-route |
Summary of Findings
Respondent Profile
- Geography – More than half of respondents represented rural service types, and more than one-third represent urbanized services.
- Age and Gender – Seventy-seven percent of respondents were between the ages of 18 and 64. Sixty percent were female and 40 percent male.
- Income – Half of the respondents’ had earnings within the lowest household income response category (under $25,000). Only eight percent have a household income higher than $49,000.
- Language – Less than one percent of the surveys submitted were completed in a language other than English.
- Ethnicity – 78 percent of respondents were white. Black/African-American Mixed/Other, Asian and Hispanic respondents range from three to seven percent of the total.
- Driver's License – More than half (59 percent) of respondents do not have a driver’s license.
- Disability – 39 percent of respondents reported identifying as someone with a disability, while 19 percent report having a physical condition that requires assistance to use transit.
Transit Behaviors
- Primary transit destination – Nearly two-thirds (65 percent) of respondents list work or school as a primary transit trip destination.
- Mode choice – 27 percent of respondents prioritized convenience when choosing their mode of travel. Travel time is the second most cited factor at 17 percent.
- Transit use – Half of respondents ride transit five to seven days per week, with 82 percent of respondents riding transit at least twice a week.
- Tenure – One-third of respondents have ridden transit for more than five years, and 73 percent have been riding transit for at least a year.
Attitudes and Opinions
- Satisfaction – Fifty-one percent of respondents are “Very Satisfied” with transit service availability in their community. Thirty-four percent are “Satisfied” and 10 percent are “Somewhat Satisfied”. Five percent are dissatisfied with service.
- Travel needs served by transit – More than 70 percent of respondents note that “75 percent or more” of their travel needs are served by transit.
- Desired improvements – When given the choice to select desired improvements to transit, 42 percent selected longer service hours and 24 percent selected increased reliability (transit arriving on-time). A high percentage (18 percent) of respondents selected “Other (please specify).” Comments listed under this response consist mainly of a desire for longer hours of service or providing service on weekends.
- Preferred source of information – Forty percent of respondents picked flyers/newsletters as the preferred source for receiving transit information. Twenty-four percent prefer newspapers, and 22 percent prefer transit websites. Less than 15 percent of respondents listed social media platforms as a preferred source of transit information.
Differentials by Transit System Type
- Respondents on the urbanized systems are younger than the statewide average (22.5 percent more between ages 18–34) and are most likely to be riding transit to work or school (80 percent vs. 65 percent). They have the highest level of transit satisfaction, but the lowest share of respondents that have at least 75 percent of their travel needs served by transit. They have a considerably higher rate of preference for receiving transit information via transit websites and social media platforms compared to riders in small urban or rural areas.
- Respondents on the small urban systems fall in between urban and rural riders in terms of age. More than half (57 percent) use transit as a primary means to access work or school. Small urban system riders are more likely to use transit for shopping and errands than other service areas. They have a level of satisfaction slightly above the overall survey average, and the rate of respondents that consider at least 75 percent of their travel needs served by transit is 1 percent below the overall survey average. Small urban systems had a much lower rate of response compared to other service areas, comprising just 6 percent of total Greater Minnesota results.
- Respondents of rural systems are more likely to be above the age of 65 and less likely to be between ages 18–34 as compared to riders of the other service types. They are less likely to use transit to access work or school than riders are of other service types; however, they are more likely to use transit to access medical destinations and for shopping. Compared to other service areas and the statewide average, they have a considerably lower rate of having a driver’s license (28.1 percent) and a higher rate of physical conditions that require assistance to use transit (29 percent reported having a condition affecting access to the bus). They have a level of satisfaction above the statewide average, and have the highest rate of respondents who consider at least 75 percent of their travel needs served by transit (73.7 percent).
On-board Survey Conclusion
The findings of the on-board survey provide valuable insights about the current transit users in Greater Minnesota. The results point to differences in the demographic and behaviors of riders among rural, small urban and urbanized systems. However, many ideas and views about existing transit service in Greater Minnesota are similar among riders in all communities.
Overall, the survey results reveal that the majority of transit users in Greater Minnesota are female, white and low-income. More than 75 percent of riders fall within the category of “commuter age” (18–64) and more than half do not possess a driver’s license. This can help transit agencies target marketing and services toward these users. A significant number of riders (about 25 percent) have been riding for less than one year, showing that transit may be appealing to an increasingly broad audience in Greater Minnesota.
While many characteristics are similar for all service types, there is a difference among rural, small urban and urbanized riders. Rural riders are more likely to be elderly, without a driver’s license, disabled, and dependent on transit for trips other than work or school. Rural riders are less likely to ride transit on a daily basis compared to riders in small urban or urbanized communities.
In terms of attitudes and opinions, transit operators across Greater Minnesota earned high levels of satisfaction from riders in all communities. As a whole, riders expressed a desire for longer service hours, improved reliability and weekend service. In regards to how information is distributed, older riders preferred traditional sources of media such as flyers/newsletters and newspapers. Younger riders request more information through websites, social media and email.
Online Community Survey
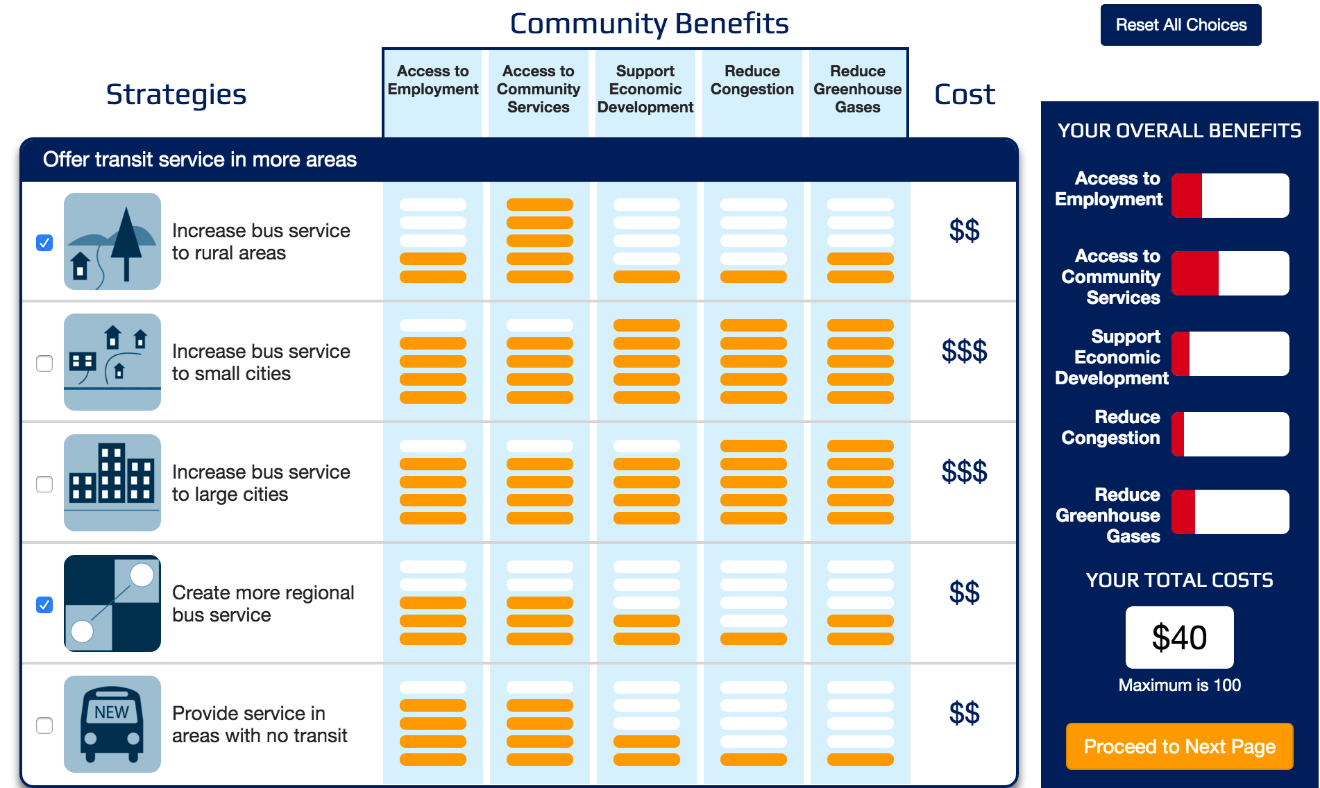
The online survey included two components: (1) a needs assessment asking about travel patterns and why transit is or is not a good option, and (2) a game-like component that asked people to prioritize transit service improvements based on cost and potential community benefits. A planning game—titled “Design Your Own Transit System”—used a game interface to identify service priorities by asking people to select transit service improvement strategies from a variety of choices. Strategies were grouped into four major categories:
- Service area expansion
- Existing service enhancements
- Facilities
- Information Systems
Each strategy has a cost and an explanation how it would contribute to the community:
- Access to employment
- Access to community services
- Support economic development
- Reduce congestion
- Reduce greenhouse gases
Respondents were given a maximum spending budget. This required respondents to prioritize improvements based on community benefits, cost and personal preference. Figure 5-3 shows a screenshot of one of the strategy tables from the survey.
Figure 5-3. Design Your Own Transit System Survey Screenshot
To reach out to populations typically under-represented in community engagement, the survey was translated into Somali, Hmong and Spanish, as well as into an ADA-compatible format. One response was received for the non-English surveys and seven responses were received for the ADA-compatible survey. MnDOT promoted the survey via social media and purchased additional advertising on Facebook. A total of 341 responses were collected for this exercise.
Summary of Findings
Summarized below are the key findings and themes from the online community survey.
- The survey reached a variety of current and potential transit users across the state – Respondents were well spread across the state, and one-fifth of the respondents used bus transit within the past year. Those who used transit used a variety of services, including fixed-route bus services, commuter rail and dial-a-ride. Those who used transit used it in different ways, with some respondents relying on daily service and others using transit for occasional trips. Two-thirds of respondents indicated they would consider using transit if it served their community.
- Respondents would like to reduce their automobile use due to associated travel costs and environmental concerns – These were key factors in choosing to use public transportation. Marketing campaigns that encourage transit as a way to reduce vehicle use should be considered.
- Regional service expansion, longer service hours and frequency increases are high priority improvements, especially for respondents who do not currently use transit – The top two desired improvements were more service in outlying communities and service beyond city/county boundaries. These improvements were selected at a higher rate among non-riders. Regional bus service and service in areas without transit were selected by many respondents in the “Design Your Own Transit System” portion of the survey. Respondents also said service span and frequency increases are desired.
- The most important community benefit of transit was access, with congestion mitigation the least important – This indicates that congestion is likely not a problem for survey respondents or those reasons are not at the top of the list of why a person chooses to take transit.
Online Mapping Tool - Origins and Destinations
An interactive online mapping tool was developed to better understand travel patterns of current transit users and non-transit users. Information collected through this tool can help quantify the need for public transportation within and across communities. Analyzing destinations and travel patterns helps transit agencies and communities identify where additional or enhanced transit service is desired and where there is a need for further study and outreach on existing service.
Wikimapping tool
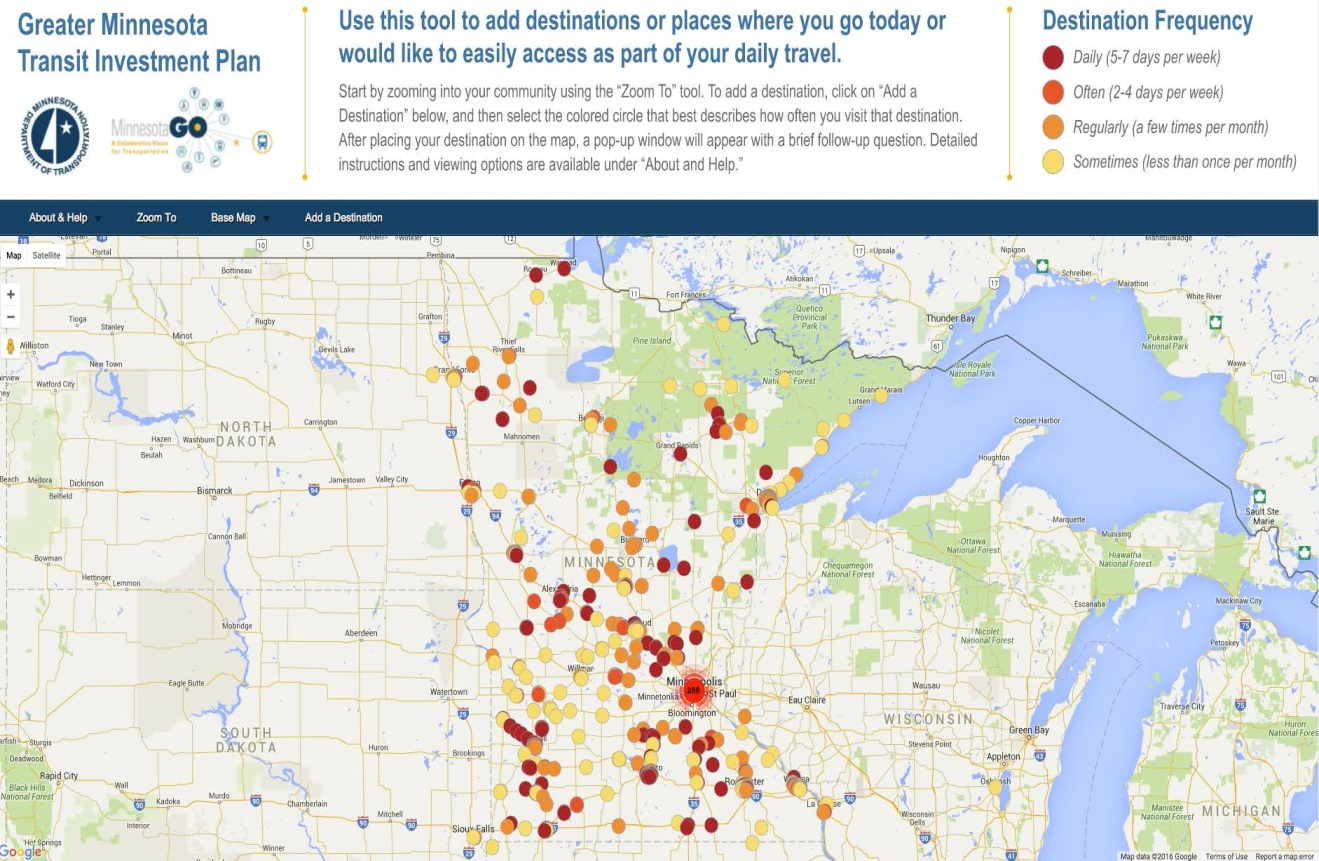
MnDOT created an interactive online mapping project using a Wikimapping platform to gather transit user and non-transit user existing and desired destinations (see Figure 5-4). Participants tagged their usual destinations on a Google map and also provided the destination type such as “work”. Each user’s data was tied to a unique identifier, allowing for origin-destination analysis and for users to revisit and update the site multiple times without needing to create a new account. Participants were asked a series of questions, including their current level of transit usage, how frequently they travel and the primary purpose for traveling to each destination. There was no limit to the number of destinations each user could contribute.
Figure 5-4 - Wikimapping Tool
Destination Survey Tool
An ADA accessible destination survey was also available for users uncomfortable with or unable to use the Wikimapping tool. Similar questions were asked in the survey, including current transit use, common destinations and trip purpose. Rather than entering destinations on a map, participants typed addresses and descriptions of destinations. These destinations were later geocoded and combined with the destination information received through the Wikimapping tool to comprehensively map and analyze travel patterns.
Distribution of Tools
The Wikimapping and destination survey tool were available from mid-December 2015 to the end of February 2016. Both were accessible through the “Get Involved” page of the project website and were shared in several email blasts to various stakeholders. Links to the surveys were posted on MnDOT social media pages weekly throughout the open survey period.
Summary of Findings
Destination responses were received from every MnDOT district and several outlying states. In total, the Wikimap and destination survey yielded 1,481 responses from 341 unique users. Of the 341 unique users, 153 used Wikimaps to enter destinations (45 percent of users) and 188 used the destination survey to enter destinations (55 percent of users). However, Wikimap users entered an average of seven destinations per user, while destination survey users entered an average of two destinations per user. Key findings and themes from the origins and destinations survey are summarized below.
- Transit users are more likely to have lower incomes, have larger households fewer cars per household, and are more likely to be employed part-time than non-transit users.
- The majority of respondents to the Wikimap and online destination survey were non-transit users (76 percent)
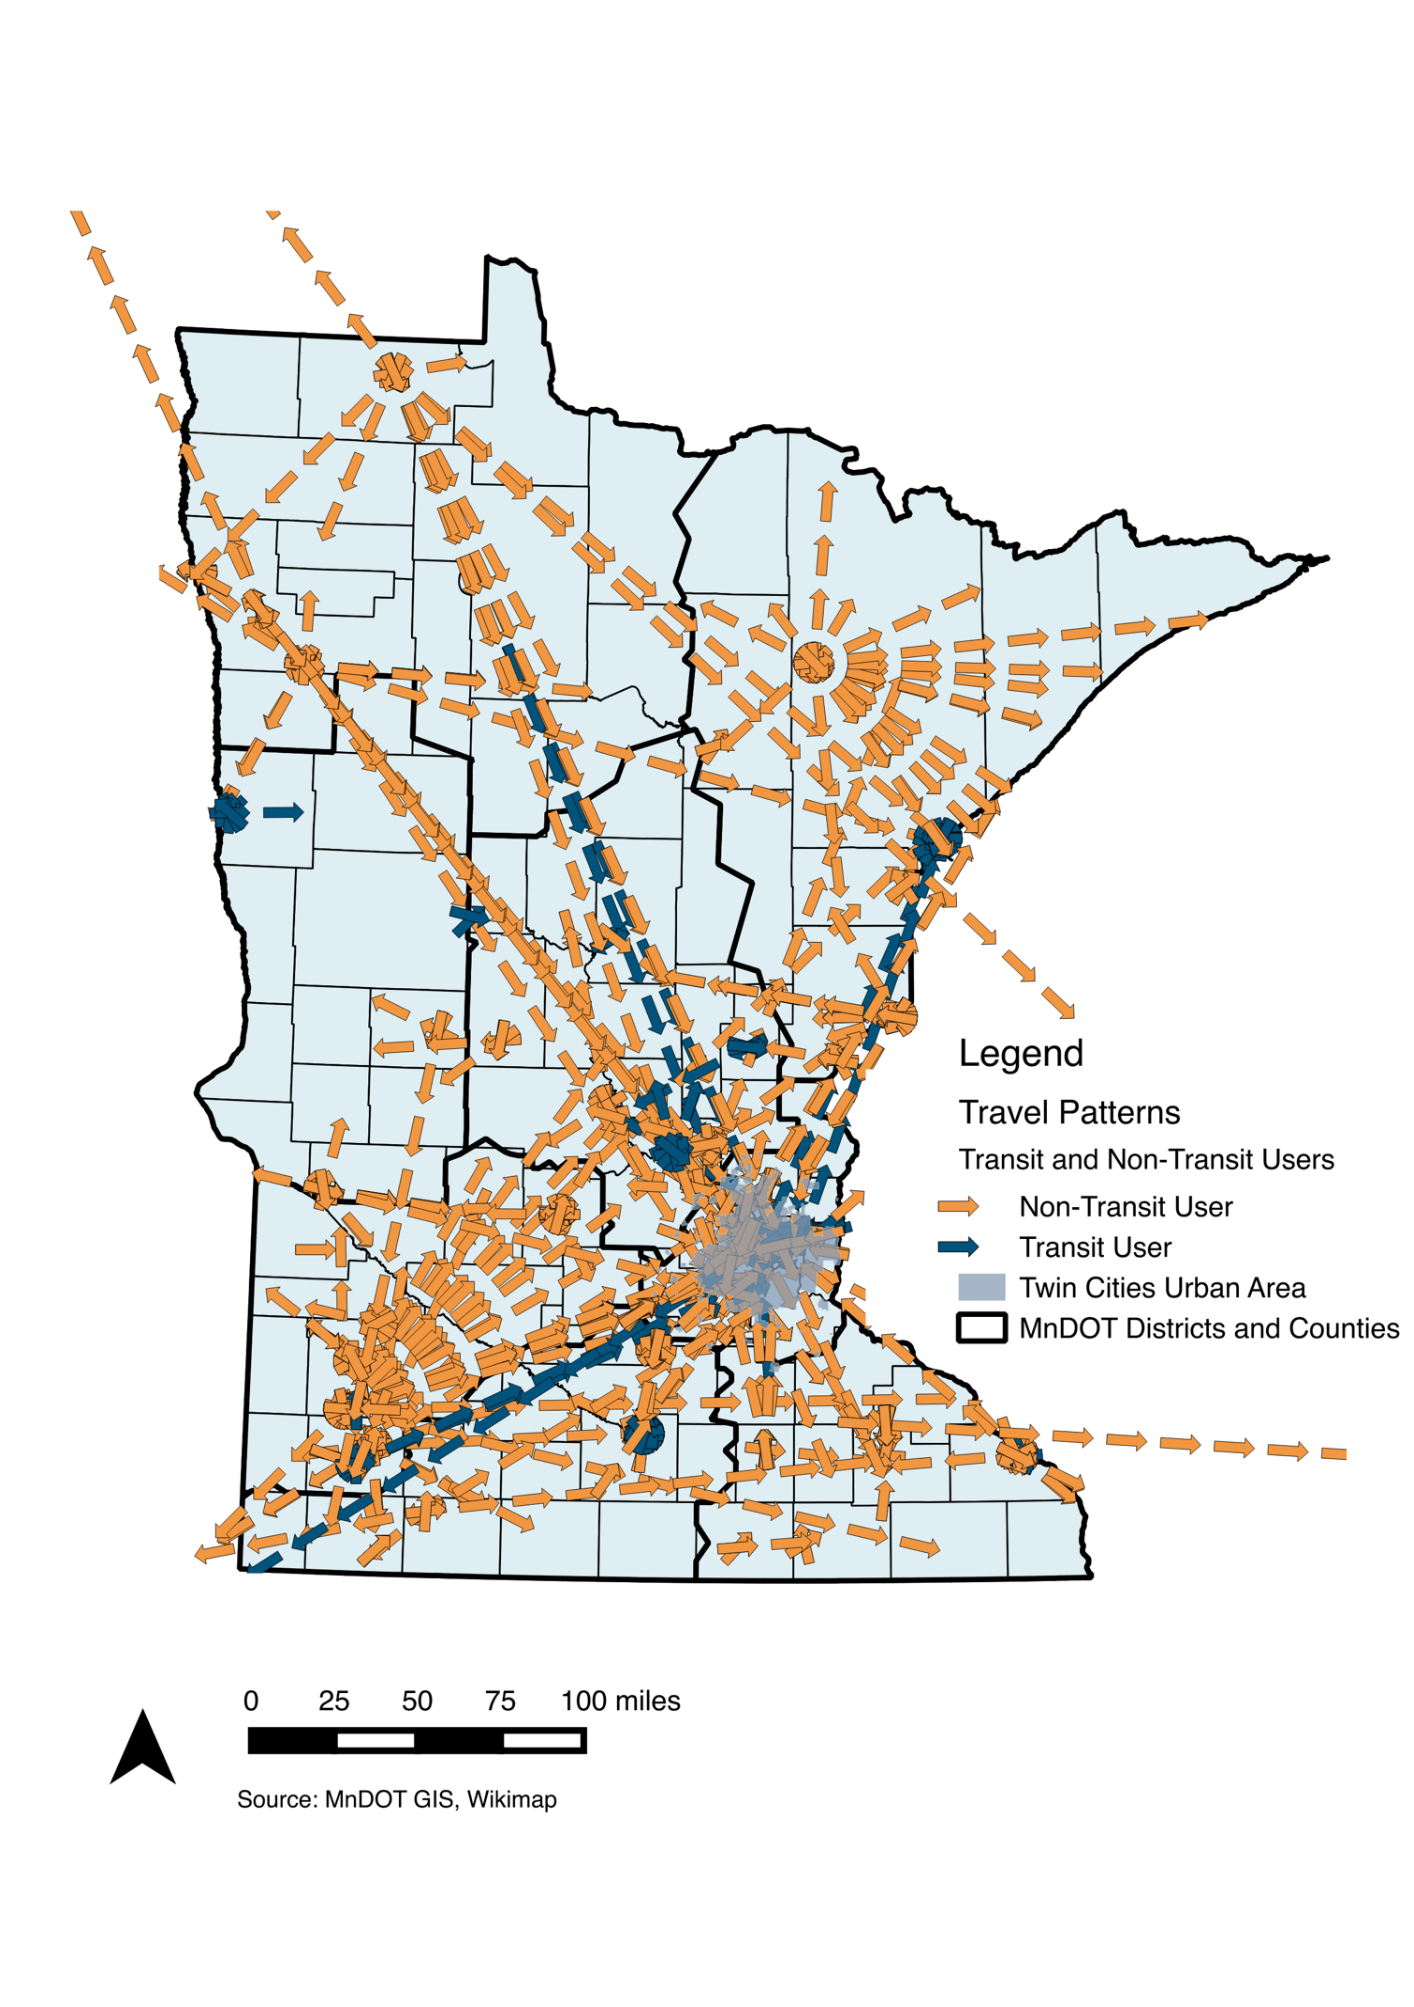
- Non-transit users and transit users identified a need for trips crossing county lines and connections to cities in other MnDOT districts, as shown in Figure 5-5. Transit providers may need to provide service opportunities that cross county lines and connect cities in other districts to reach this new market. This may require updating service areas and/or current funding structure. Coordinating service schedules and/or co-locating transit stops to allow for transfers among neighboring transit agencies may be a near-term solution to provide long-distance or city-to-city service. In some cases, consolidating transit providers may allow agencies to cover larger areas to further meet the need for longer distance travel.
- Many non-transit users identified local destinations that could be served by transit. Non-transit users who have access to transit may be more likely to use transit if transit also served additional nearby destinations. The Wikimapping and destination survey tool may provide support to modify existing service to serve more short distance trips through transit, including information on trip purposes, desired time of day travel to nearby destinations, and reasons for not using transit. Short distance travel patterns may indicate an opportunity to provide more information on available transit service to potential riders and an opportunity for transit providers to increase farebox revenue through a greater number of short distance trips.
Figure 5-5 - Existing and Desired Travel Patterns
"Hard to Reach" Populations
MnDOT placed a high priority on connecting with and receiving input from a diverse set of Minnesota residents, including seniors, low-income populations, persons with housing instability, individuals with disabilities, veterans and New Americans. Collectively, outreach to these “hard to reach” population groups was conducted with paper surveys (since internet access is often limited for certain population groups), in person presentations and stakeholder discussions.
MnDOT developed a paper survey with pre-paid postage to provide an alternative opportunity to participate in the GMTIP update for populations with limited internet access and/or computer skills. Several human service organizations across Greater Minnesota were contacted directly to assist in distributing the paper survey. These project partners were asked to give the surveys to clients during appointments, at meetings and at each organization’s front desk. Surveys were shared at community meetings and tribal council briefings attended by MnDOT staff during the plan update. Project partner organizations included:
- Arrowhead Bookmobile Services
- Bi-County Community Action Programs, Inc.
- Leech Lake Band of Ojibwe
- Mille Lacs Band of Ojibwe
- Minnesota Valley Action Council
- Northwest Community Action
- Prairie Five Community Action Council
- Semcac
- Vine Faith in Action
- West Central Minnesota Communities Action, Inc.
MnDOT also developed an online version of the survey as another way to collect information, particularly with college students. The survey link was shared with the organizations and through email, Facebook and other social media outlets.
Key Findings
A total of 158 completed paper and 241 online surveys were received. Key findings and themes from the survey aimed at collecting input from hard to reach populations are summarized below.
- The majority of respondents did not use transit in the past year (87 percent). Of these non-transit users, 41 percent indicated that they would use transit if it served where they lived, and 34 percent were not sure if they would use transit if it were available.
- Participants identified a need for transit to better reach outlying cities or communities and provide service beyond city or county boundaries, better information on how to use transit more frequent service and more evening or night service.
- Participants are more likely to choose transit if it is convenient, low cost and allows for flexibility in travel plans.
- Participants most preferred to receive transit information and updates by email, newspaper, flyers, and newsletters. Paper survey respondents were less likely to prefer email than online survey respondents were.
In summary, paper survey respondents were more likely to have lower incomes, have larger households, fewer automobiles per household, more likely to have a disability and more likely to be ethnically or racially diverse than online survey respondents.
Tribal Consultations
MnDOT’s Office of Transit worked with multiple tribal nations throughout the planning process. Staff received input on the plan from tribal leaders through guided discussions. Staff also met with and worked with three tribes in Greater Minnesota. During these events, staff used a participatory mapping exercise to understand the regional travel demand of tribal members in addition to distributing the ‘hard to reach’ paper survey.
In summary:
- Staff met with Grand Portage Tribe planning staff and presented highlights of the planning process. Community staff at Grand Portage completed the paper survey in spring 2016.
- Staff also participated in the Mille Lacs Tribe Band meeting in fall of 2015. The GMTIP was briefly presented followed by two exercises to gather input from the tribal members. First, a participatory mapping exercise where participants used dots on table-top maps to identify their regional travel destinations. This helped MnDOT understand that people were crossing boundaries to access other trade centers. Second, the staff distributed and collected the ‘hard to reach population’ paper survey.
- Staff also participated in Winterfest at the Leech Lake Reservation in winter, 2016. Approximately 250 people attended the community event. Staff used the regional mapping exercise to capture travel destinations and the “hard to reach” paper survey for priorities.
Community Input Conclusions
Understanding the amenities and types of service desired by transit customers is essential to help determine how well service meets needs and where gaps lie. Surveys conducted with riders and non-riders reveal customer expectations that influence whether a person will get on a bus.
- Regional service expansion, longer service hours and increased frequency are high priority improvements, especially for those not currently using transit. Highly desired improvements include more service in outlying communities and beyond city/county boundaries, along with service span and frequency increases. Many users desire more reliable transit service. Reliability can be measured using on-time performance for fixed route service and customer denial rates for demand responsive services.
- Frequent service is highly desired by riders and non-riders when determining potential transit use. Currently, fixed-route systems maintain average headways of less than one hour, with the exception of St. Peter Transit and Winona Transit. Most rural and small urban systems operate demand-response services. These services do not have an “average” headway.
- Weekend service is another priority for riders, especially those who do not currently use the service. Currently, the majority of ADA-complementary para-transit, urbanized and small urban systems offer Saturday service, with the exception of La Crescent Apple Express. Sunday service is rarer. Among urbanized systems, only two providers offer Sunday service. Weekend service among rural and small urban providers is similarly varied. A number of providers offer half-day service on either Saturday or Sunday. Only five rural providers offer both Saturday and Sunday service.
- Evening service, defined in this case as service past 7 p.m., is highly desired by users wishing to take transit outside of normal commuting hours. Half of the urbanized systems provide evening service. A similar trend is found for small urban systems, with about half providing service past 6 p.m. Evening service is much rarer among rural service providers, where only around 12 percent of providers offer evening service. All providers offering evening service also offer service on at least one weekend day.
- For riders, the ability to view a schedule online makes trip planning much more convenient and is highly desired. All urbanized and small urban systems have online schedules available to the public for fixed route service. The vast majority of rural service providers have service operating hours and days listed online.
- The ability to travel between cities/counties throughout the state is important for providing access to users. Currently, only providers serving multiple counties operate inter county services. This service preference is only found among rural providers.
In summary, the lessons learned through the public outreach effort, such as the need for longer service hours and improved frequency, are directly tied to the development of the Service Plan that will address customer needs and increase ridership. In addition, rider and non-rider expectations and needs are addressed in the strategic direction and strategy prioritization.