
Chapter 6: Priorities for Additional Revenue
Over the next 20 years, MnDOT estimates there will be $21 billion in available revenues to address $39 billion in identified transportation needs, resulting in a funding gap of approximately $18 billion. Roughly one-quarter of this gap, or $4 billion can be attributed to a reduction in buying power. Over the planning period, revenues are not expected to keep pace with forecasted inflation for the construction-related sector. The remainder of the gap represents unfunded capital improvements needed to maintain aging infrastructure and meet Minnesotans’ growing transportation needs. Given this gap, there will be many unmet needs and priorities within MnSHIP’s 20-year horizon.
This chapter includes a description of the remaining risks for each investment category and the feedback from public outreach and internal discussions which outline the investments that the agency would prioritize if any additional funding became available.
The key messages of Chapter 6 are:
- The funding gap in MnSHIP will result in significant unmet needs across the investment categories which will affect both system conditions and the experience for the traveling public
- If additional resources become available, investment priorities will reflect the principles, policy objectives, and strategies put forth in the “family of plans” and the input received from the public and stakeholders in the development of this plan
Unmet Needs
The unmet needs presented in this chapter refer to the same set of needs presented in Chapter 3: Investment Needs. Due to the substantial differences between investment needs and available revenues, MnDOT does not expect to fund any investment category to its full needs amount through 2037. Therefore, MnDOT does not expect to be able to deliver a program of capital improvements that wholly meets the expectations of stakeholders and the travelling public.
For the state highway system, the difference between the 20-year needs and the amount MnDOT plans to spend in each investment category over this timeframe is shown in Figure 6-1. MnDOT estimates there will be a funding gap of approximately $18 billion over the next 20 years. Both immediate investment needs and those expected to arise over the next 20 years will not be fully addressed. As a result, the state will not be making significant progress toward realizing the Minnesota GO Vision and MnDOT will fall short of meeting its performance-based goals.
Figure 6-1: Summary of Unmet Needs through 2037
| Investment Category | 20-Year Needs | 20-Year Expenditures | Unmet Needs | Under-funded Improvements |
|---|---|---|---|---|
| Pavement Condition | $13.44 billion | $10.31 billion | $3.13 billion | Non-Interstate, NHS and Non-NHS pavement condition |
| Bridge Condition | $2.65 billion | $2.38 billion | $270 million | NHS bridge condition |
| Roadside Infrastructure Condition | $3.35 billion | $1.60 billion | $1.75 billion | All elements such as culverts, signage, lighting |
| Jurisdictional Transfer | $1.14 billion | $90 million | $1.05 billion | Transfer of optimal roadway miles |
| Facilities | $390 million | $80 million | $310 million | Rest areas and weigh stations |
| Traveler Safety | $1.37 billion | $670 million | $700 million | Sustained crash locations, proactive treatments |
| Twin Cities Mobility | $4.58 billion | $240 million | $4.34 billion | MnPASS express lanes, major capacity and spot mobility improvements |
| Greater Minnesota Mobility | $1.39 billion | $25 million | $1.36 billion | Low cost and high cost capital improvements to improve travel time delay |
| Freight | N/A | $610 million | - | Freight needs are identified in other categories |
| Bicycle Infrastructure | $580 million | $140 million | $440 million | Stand-alone bike projects, statewide bikeway projects |
| Accessible Pedestrian Infrastructure | $680 million | $530 million | $150 million | Other pedestrian improvements not related to ADA compliance of existing infrastructure |
| Regional and Community Improvement Priorities | $2.62 billion | $310 million | $2.31 billion | Significant investments to address local or regional quality of life and economic competitiveness. Flood mitigation |
| Small Programs | $630 million | $630 million | - | Not applicable |
| Investment Category Total | $33 billion | $18 billion | $16 billion | - |
| Project Delivery costs | $6.18 billion | $3.27 billion | $2.91 billion | Cost to deliver capital projects based on analysis of historic- expenditure patterns |
| Investment Category Total Plus Project Delivery Costs | TOTAL=$39 billion | TOTAL=$21 billion | TOTAL=$18 billion |
System Stewardship: Unmet Needs
Pavement Condition
Based on the spending strategies outlined in Chapter 5: Investment Direction, interstates will have twice as many miles in poor condition while all non-Interstates will have three to four times as many miles in poor condition at the end of the plan period. Pavements on any state system are not expected to meet their respective MnDOT statewide condition performance targets. Worsened road conditions will negatively affect the movement of vehicles, freight and bicycles. These impacts will lead to an increase in maintenance costs and overall shortened life span of state highways.
Bridge Condition
The amount of National Highway System bridges in poor condition will increase slightly compared to today while non-NHS bridges in poor condition will increase threefold. This will potentially result in the need for weight restrictions on some bridges and more frequent service interruptions on the system, resulting in longer trips for carriers of critical goods and services. Total life cycle costs to maintain bridges will also increase.
Roadside Infrastructure Condition
Delaying the response to growing culvert and underground drainage needs is a high risk. In addition, delaying the response shifts the burden to replace or repair many roadside infrastructure elements from capital to operations and maintenance budgets. Delaying repairs does not align with optimal life cycle investments or public expectations and standards that could result in non-compliance with safety and accessibility standards.
Facilities
The condition of rest areas and weigh stations will continue to deteriorate. Weigh scales at weigh stations will become outdated and enforcing weight restrictions becomes ineffective and increasingly difficult. Rest areas will not make progress towards complying with the 1990 Americans with Disabilities Act standards, and a few rest areas may close as a result of delayed maintenance and repairs.
Jurisdictional Transfer
MnDOT has limited ability to find opportunities to realign roadways under the correct agency. Roadways that are currently owned by MnDOT but would better serve the traveling public if owned by a local agency, will not be repaired or transferred. This results in potentially foregone savings from future maintenance and capital costs.
Transportation Safety: Unmet Needs
Traveler Safety
Outcomes for Traveler Safety are difficult to project. Recent years saw a substantial decline in the annual number of fatalities and serious injuries on Minnesota roads due to a robust program of safety improvements and Toward Zero Deaths strategies. However, MnDOT’s reduced investment in Traveler Safety over the next 20 years may cause this trend to slow or even reverse. Sustained crash locations will be left unaddressed. There are fewer opportunities to invest in new safety treatments and some existing safety features will deteriorate. The low fatality and serious injury rate goals set by the TZD program may be difficult to achieve without continued investment to support safety improvements. Other program resources – safety education, enforcement, and emergency services – will become even more important in keeping fatal and serious injury rates low but new federal law restricts MnDOT’s continued funding participation.
Critical Connections - Unmet Needs
Twin Cities Mobility
MnDOT will fund Twin Cities Mobility through the first six years of the plan (years 2018-2023), leaving many anticipated needs unaddressed. Congestion in the metropolitan area will lead to greater freight costs, decreased quality of life and lost productivity for metro area residents. MnDOT will not be well-positioned to address expected regional growth and anticipated increasing congestion and reliability issues, resulting in unpredictable travel times and potentially negative impacts to the state and regional economy. In the absence of any additional revenue, Twin Cities Mobility remains a high risk at the end of the planning period.
Greater Minnesota Mobility
In the absence of major investments to improve mobility needs in Greater Minnesota over the next 20 years, the NHS will be subject to less predictable travel times and unstable flow. As a result, MnDOT will be unable to make progress towards a number of objectives in communities across Minnesota, including improving multimodal connections, community livability, economic competitiveness, environmental health and quality of life.
Freight
At this time, MnDOT has not estimated its 20-year needs for freight on the state highway system. The investment in the Freight category identified in MnSHIP reflects the amount provided for the National Highway Freight Program as part of the FAST Act. Needs related to freight movement are identified in other investment categories so there is no separate need category for freight in this MnSHIP update. The upcoming Minnesota Freight Investment Plan will identify priorities to spend money for freight improvements.
Bicycle Infrastructure
Stand-alone bicycle improvements and priority state bikeways will not be funded during this period despite increasing demand for non-motorized transportation options. Bicycle facilities, including shoulders, will not be maintained well enough to ensure safe, easy access to bikeways. State highways may continue to be barriers to bicycle movement in many locations, although they will continue to allow bicycle movement along them.
Accessible Pedestrian Infrastructure
MnDOT plans to invest in pedestrian facilities and infrastructure to become substantially compliant with the ADA standards by the end the 20-year period. This includes investments that are made concurrently with pavement and bridge projects, and stand alone improvement projects.
Healthy Communities: Unmet Needs
Regional and Community Improvement Priorities
MnDOT does not plan to fund urban reconstruction projects in the RCIP category due to limited funds. These projects also accommodate improvements to local facilities. High priority roadways that are prone to flooding would remain at risk. At this funding level, there would be no opportunities for locally driven priorities such as capacity improvements without additional revenue.
Other: Unmet Needs
Small Programs
MnSHIP assumes MnDOT will continue to need a fixed amount of funds throughout the 20-year timeframe to respond to short-term, unforeseen issues and continuing commitments. MnDOT currently plans $32 million per year or 0.3 percent of its total projected revenue to cover investments in Small Programs.
Assuming that the current investment level is held constant throughout the next 20 years, approximately $630 million is needed to fund small programs. This MnSHIP update has reduced the size of Small Programs such as rest area, weigh station and economic development investments, which have been incorporated into other MnSHIP investment categories.
If MnDOT does not fully spend its annual allocation for small programs in a given year, it directs the funds toward its highest unaddressed risks in the capital program.
Project Delivery
MnDOT estimates that achieving its targets and key objectives in the areas of System Stewardship, Transportation Safety, Critical Connections and Healthy Communities would require approximately $6.18 billion in Project Delivery through 2037. The MnSHIP investment direction includes $3.27 billion for Project Delivery. An additional $2.9 billion would be required for Project Delivery if MnDOT were to deliver a program that meets the needs in all of the MnSHIP investment categories.
MnDOT estimated the amount historically spent in this category to establish the proportion of the overall investment that would be required to design, engineer and construct projects over the next 20 years. Approximately 16 percent of MnDOT’s annual capital investment typically goes to supporting the delivery of projects. The percentage of spending in project delivery has changed significantly since 2013 MnSHIP as a result of more thorough analysis of actual expenditures and increased requirements for MnDOT projects.
Risk Management Results
During the MnSHIP process, MnDOT identified 11 key risks related to implementing MnSHIP’s capital investment priorities. The following section evaluates the effectiveness of MnSHIP’s investment direction in managing these risks. The risks are grouped into the five Statewide Multimodal Transportation Plan objective areas. The risks and objective areas are displayed below.
System Stewardship
What Success Looks Like: The useful life of transportation assets and system performance are maximized while placing an emphasis on the priority highway network resulting in minimized costs and impact to the state’s economy, environment and quality of life.
Key Investment Risks:
- Federal Performance Requirements: Failure to achieve Federal performance requirements on Interstate pavements and NHS bridges reduces flexibility to spend future revenue on other state priorities
- Remaining Service Life: The investment direction limits MnDOT’s ability to perform the right fix at the right time, which leads to a decreased useful lifespan of the asset and more expensive fixes later
- Operations Budget: Maintenance costs rise, which places undue pressure on the operations budget and adds travel disruptions
- Increased costs to users: Poor asset management ultimately leads to increased costs to users of the system and Minnesota’s economy by placing weight limitations on bridges
Transportation Safety
What Success Looks Like: Travelers of all modes and the communities the transportation system travels through are safeguarded. The state is able to plan, design, build, operate and maintain critical safety infrastructure and facilities to improve the safety of users across the system.
Key Investment Risks:
- Safety Infrastructure: Critical traveler safety features begin to deteriorate, limiting their effectiveness
Critical Connections
What Success Looks Like: Multimodal transportation connections and networks are maintained and expanded. Building the connections between workers and jobs, cities and regions and between different modes maximizes social, economic and environmental benefits. Equitable access to goods, services and opportunities are provided.
Key Investment Risks:
- Multimodal Priorities: Reduced investment in critical connections limits MnDOT’s ability to advance modal priorities
- Mobility: Limited investment impacts mobility of people and goods, which negatively impacts economic health
Healthy Community Objective
What Success Looks Like: Higher priority is given to improvements which consider complementary land uses and the surrounding context that maximizes community benefits, limits long-term costs and creates infrastructures that is reflective of the surrounding environment.
Key Investment Risks:
Urban Reconstruction: A focus on statewide performance measures and asset management results in lack of investment in urban reconstruction projects
- Responsiveness: Limited investment reduces MnDOT’s ability to support local economic development and quality of life opportunities
- What Success Looks like: Supporting and implementing investments that preserve natural resources and prevent natural resources and natural events from causing damage to the transportation system.
Key Investment Risks:
- Climate Change: Inadequately addressing the effects of climate change and flooding leads to unplanned road closures and increased maintenance costs
Open Decision Making
What Success Looks like: Make transportation system decisions through processes that are inclusive, engaging and supported by data and analysis. Engage the public and stakeholders to understand their priorities and to also educate them on system wide goals along with project specific information.
Key Investment Risks:
- Legislative Action: Misalignment between MnSHIP investment direction and legislative priorities results in legislation that redirects financial resources and compromises plan outcomes
Figure 6-2 broadly illustrates the key investment risks posed by the investment direction, the likelihood that the risk will occur and the reason why MnDOT feels the risk is unlikely or highly likely to occur. The 11 risks vary in terms of their impact and require different amounts of resources to be partially or adequately mitigated. As discussed previously in this chapter, the risks associated with asset management are significant, more likely to occur and the most costly to address.
Figure 6-2: Risk Mitigation through the 20-Year Investment Plan
| Key Investment Risk | Current | Future (2037) | Reasoning |
|---|---|---|---|
| Federal Performance Requirements: Failure to achieve federal performance requirements on Interstate pavements and NHS bridges reduces flexibility to spend future revenue on other state priorities. | Low | Low | Interstate pavements and NHS bridge conditions are projected to meet federal requirements through 2037. |
| Remaining Service Life: The investment direction limits MnDOT’s ability to perform the right fix at the right time, which leads to a decreased lifespan of the asset and more expensive fixes later. | Medium | High | Limited investment in bridges and pavements may increase the use of reactive, short term fixes to avoid hazardous conditions especially on non-NHS pavements. |
| Operations Budget: Maintenance costs rise, which places undue pressure on the operations budget and adds travel disruptions. | Medium | High | Limited investment in bridges and pavements may increase use of operational budget for maintenance of pavements especially on the non-NHS. |
| Increased costs to users: Poor asset management ultimately leads to increased costs to users of the system and Minnesota’s economy by placing weight limitations on bridges. | Low | Medium | Identified investment to maintain the condition of bridges should limit the risk of requiring weight limits on bridges. |
| Safety Infrastructure: Critical traveler safety features begin to deteriorate, limiting their effectiveness. | Low | Low | Safety infrastructure maintained through investment in roadside infrastructure at current investment levels. MnDOT will continue to make new safety improvements on the system. |
| Multimodal Priorities: Reduced investment in critical connections limits MnDOT’s ability to advance modal priorities. | Medium | Medium | MnDOT commits to reaching substantial ADA compliance with existing pedestrian infrastructure; however, investment in new pedestrian and bicycle connections is limited. |
| Mobility: Limited investment impacts mobility of people and goods, which negatively impacts economic health. | Low | High | No investment in mobility after 2023, although the Transportation Economic Development program continues to fund small economic development projects. Congestion is likely to increase due to projected population growth. |
| Urban Reconstruction: A focus on statewide performance measures and asset management results in lack of investment in urban reconstruction projects. | Medium | High | Investment direction limits MnDOT's ability to address urban reconstruction needs. |
| Responsiveness: Limited investment reduces MnDOT’s ability to support local economic development and quality of life opportunities. | Medium | High | Economic development projects continue through investment in the Transportation Economic Development program. Other investment in local/regional priorities is very limited. |
| Climate Change: Inadequately addressing the effects of climate change and flooding leads to unplanned road closures and increased maintenance costs | High | High | No investment identified to proactively address potential vulnerabilities to flooding. |
| Legislative Action: Misalignment between MnSHIP investment direction and legislative priorities results in legislation that redirects financial resources and compromises plan outcomes. | Medium | High | No investment in mobility after 2023. Legislature may re-direct resources to address mobility needs, which could negatively impact plan outcomes. |
Increased Revenue Priorities
MnDOT estimates that it will have $21 bill ion to spend on highway capital projects over the next 20 years. This amount is based on an analysis of MnDOT’s projected revenue sources and the assumption that key revenue sources are expected to grow slightly each year during the plan. The revenue projection also assumes that there will be no additional temporary or permanent funding sources available. However, periodically MnDOT does receive new funding. For example, new revenue could come from:
- One-time sources, such as a solicitation from the Federal Highway Administration for projects that meet certain criteria
- Temporary revenue increases, such as the issuance of bonds. However, it should be noted that bonds require a repayment method with interest
- Permanent revenue sources, such as legislative action that increases the state motor vehicle fuel tax rate or that establishes alternate funding sources
Priorities for Additional Funding
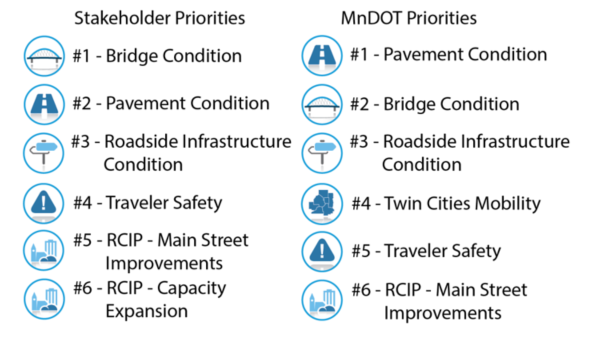
During the second round of the public outreach process, MnDOT asked stakeholders what their priorities would be should MnDOT receive any additional funding through one of the sources mentioned above. The public was asked to prioritize which categories they would like to see MnDOT invest in, beyond what is being invested through the proposed investment direction. MnDOT senior leadership and key staff were also asked their preference for investing additional revenue. Figure 6-3 below shows the ranking of stakeholder and MnDOT priorities for additional funding. Stakeholders and the public generally agreed that any extra funding MnDOT receives for capital improvements on the state highway network should be spent maintaining and repairing MnDOT’s existing assets. For the public, poorly maintained pavements and bridges were seen as a safety issue. Both groups believed investment in capacity or mobility improvements are priorities but disagreed on the preferred investment category. There was also agreement that main street improvements are important.
Based on input from the public and transportation stakeholders and MnDOT’s own internal priorities, MnDOT would prioritize spending additional funding on:
- Maintaining and repairing existing assets on the state highway system
- Strategically improving mobility and reliability at high priority locations on the NHS
- Reconstructing Main Streets
Figure 6-3: Priorities for Additional Funding
Such activities would allow MnDOT to limit the number of bridges and miles of pavement in poor condition, bringing the highway system closer to Interstate and NHS performance targets. Additional funding would increase MnDOT’s ability to address deteriorating culverts, signage and other supporting infrastructure. MnDOT would also be able to address more urban reconstruction or Main Street, projects. These projects allow local governments to improve amenities and facilities along the state highway. Mobility improvements in the Twin Cities area would be consistent with the Met Council’s Transportation Policy Plan, such as constructing MnPASS lanes, and follow the strategies for Twin Cities Mobility listed in MnSHIP. Mobility improvements in Greater Minnesota would be focused on the locations with the greatest performance issues and focus on low-cost/high benefit improvements. Completing these additional priority projects would allow MnDOT to cost-effectively meet long term performance targets and further advance the Minnesota GO Vision for transportation.
Criteria for Prioritization of expansion projects with additional funding
In recent years, the Minnesota Legislature has created funding programs to address needs of the state highway system, including mobility on the NHS and major bridge replacement. However, MnDOT has not created a planning and prioritization process to address project selection for these types of funding programs. The investment direction in MnSHIP focuses on bridge and pavement improvements. As noted above, with additional funding MnDOT would continue to invest in its bridges and pavements while also investing in other needs such as mobility. The prioritization process for bridge and pavement projects is well-established but prioritization of expansion projects has not. Many expansion projects were funded through specific programs such as the Transportation Economic Development program or Corridors of Commerce program which included their own criteria prioritizing projects.
To provide guidance on expansion project priorities, MnSHIP includes a work plan item in Chapter 7: Moving Forward, to establish criteria to evaluate expansion projects if additional money is provided by the legislature. In the meantime, MnDOT will consider the following criteria based on public outreach results and MnDOT priorities:
- Safety
- Mobility/reliability
- Freight benefits
- Multimodal benefits
Any projects funded and constructed on the state highway system should follow the guiding principles of the Minnesota GO Vision. In addition, projects should be consistent with the investment strategies in MnSHIP and the strategies and objectives in the Statewide Multimodal Transportation Plan. If projects are located within the boundaries of a Metropolitan Planning Organization, they should be consistent with the respective MPO long-range transportation plan.