
Chapter 4 – Markets for Transit and Trends in Greater Minnesota
Markets for Transit
Quantifying the need for public transportation services allows communities to see where concentrations of people and jobs are as well as where vulnerable populations live. This informs the need for transit service, routes, service levels (frequency, hours of operation), and fares. Need is an output of mathematical and census calculations. Those who need transportation find many options for getting around, including human services transportation, taxis, family, friends or transit. National experience suggests two factors influence the need for transit service more than others:
- Density - High concentrations of workers and/or residents is the most important factor in determining transit ridership. Densely developed areas such as downtown, college campuses and hospitals, have many people traveling to and from them. Their common trip patterns can be easily served by public transit. Densely developed areas are also more likely to have safe walking environments with sidewalks and crosswalks, so people can safely get to and from transit routes.
- Demographic Characteristics - Research shows that households without access to a vehicle or people with low incomes often rely on public transportation for all or a large portion of their travel. Likewise, teenagers who may not have access to a car, or older adults who may be less inclined to drive due to age or disability, also have a greater reliance on public transportation.
The types of public transportation that can meet demand vary by community context. In dense urban areas, a larger variety of services exists due to higher population densities and land use mixes. In rural areas, driving may be the predominant travel option due to long distances between destinations, and basic transit service might serve those who have no other transportation option.
Population & Employment
Population and employment densities are important factors because the clustering of people and jobs helps determine where transit routes should run. Most transit systems have two types of riders:
- “choice riders,” people who own or have access to a car but choose to take transit,
- “transit dependent” people who do not have any other option.
Analyzing overall population and employment density provides insights into the choice rider market.
Population
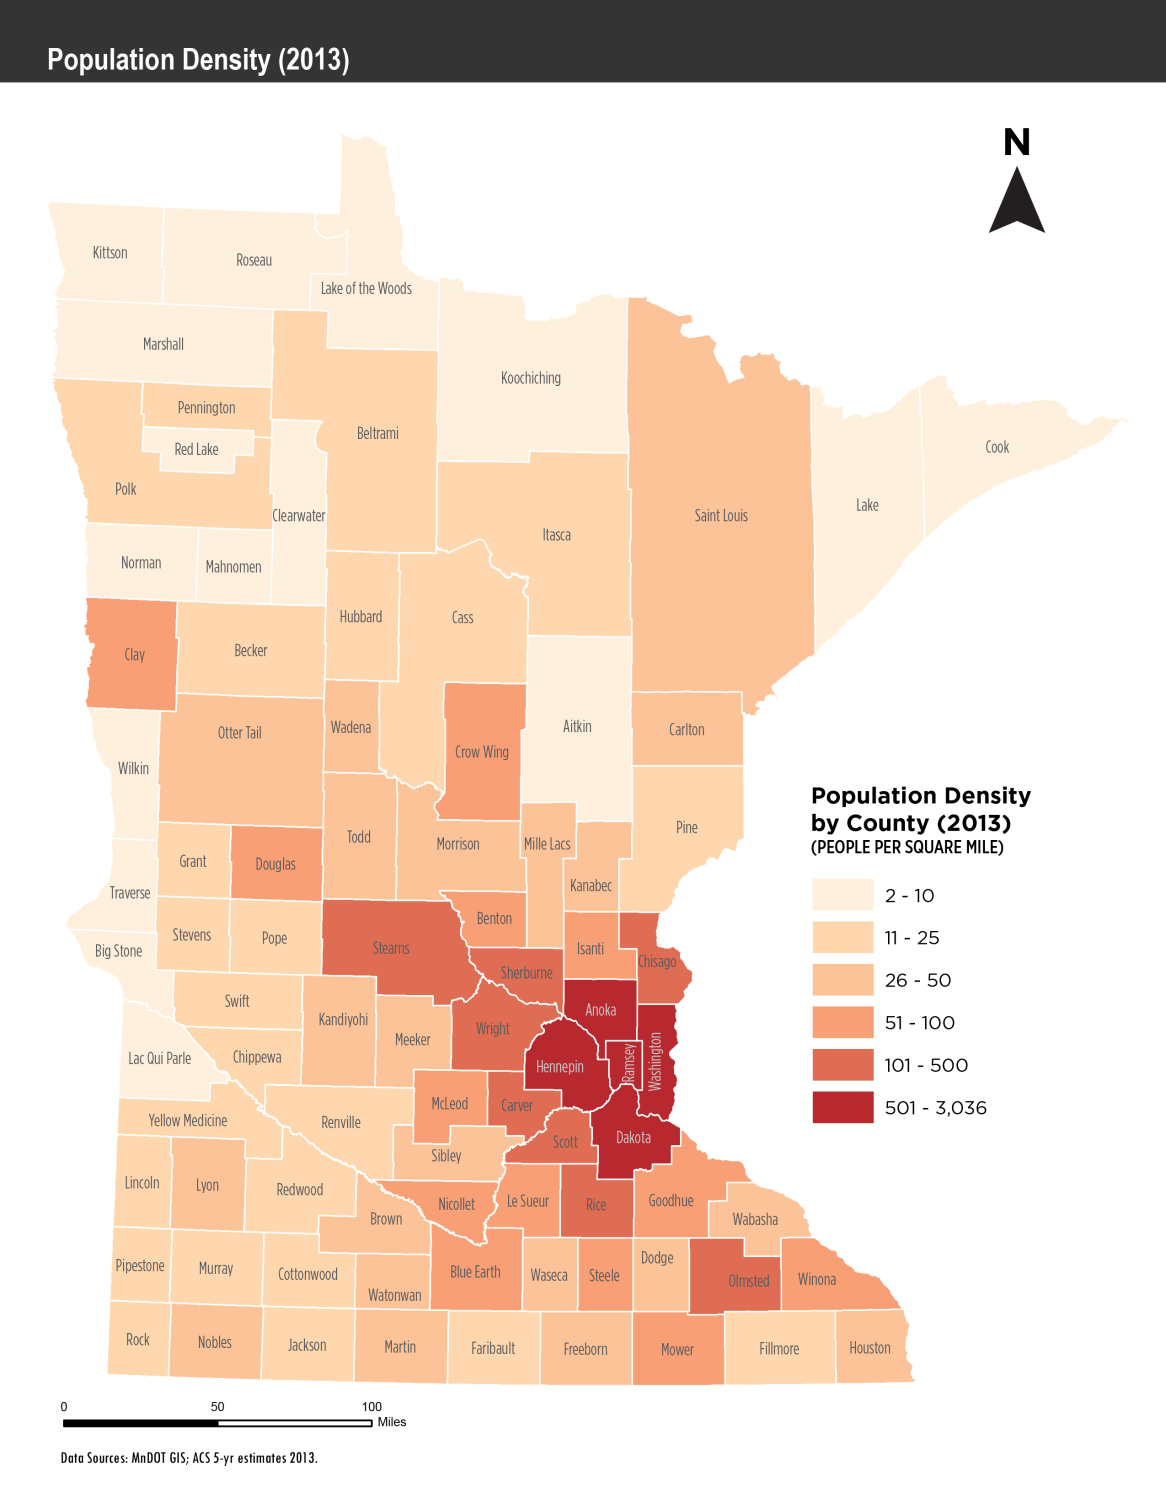
Figure 4-1 shows statewide population density by county. Overall, the counties of Greater Minnesota have a far lower population density than the seven counties that comprise the Twin Cities. With the exception of Olmsted County, Greater Minnesota counties with the highest population densities are located around the urban fringe of the Twin Cities Metro such as Sherburne and Wright counties. Lower population densities are widely distributed across the western and northern portions of the state. Many of the counties along the border of the Dakotas and Canada have countywide population densities no higher than 10 people per square mile.
Figure 4-1 - Statewide Population Density by County
Employment
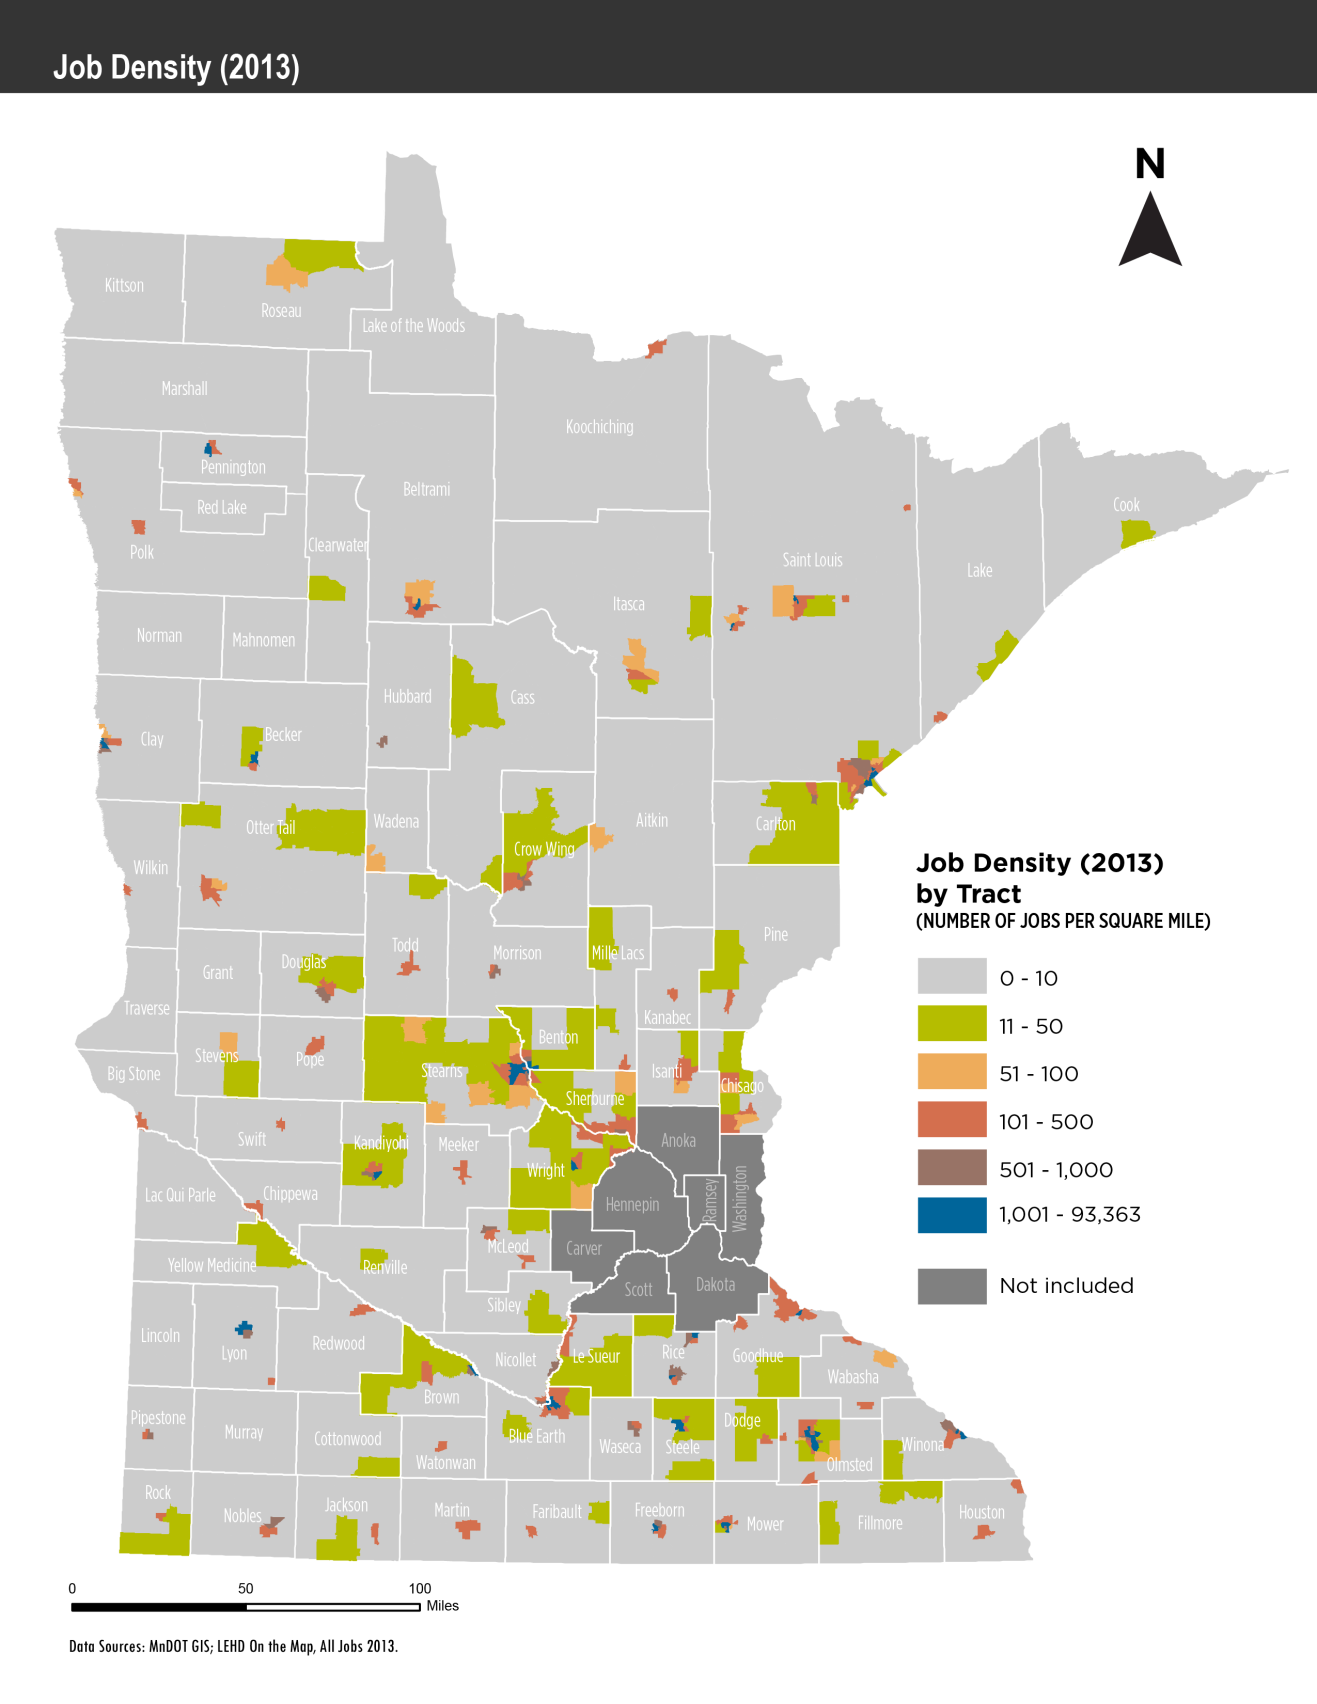
Figure 4-2 displays proportionally-sized symbols representing employment density by Census Block. Many of the state’s largest employers are located in the Twin Cities region. Considerable nodes of employment density also exist around Greater Minnesota’s largest cities such as Rochester, Duluth, St. Cloud and Mankato. Despite the low density of jobs throughout much of the state (see Figure 4-3), the wide distribution of employment sites shown in Figure 4-2 highlights the importance of countywide and regional commuter options in Greater Minnesota.
Figure 4-2 - Statewide Employment Density by Census Block
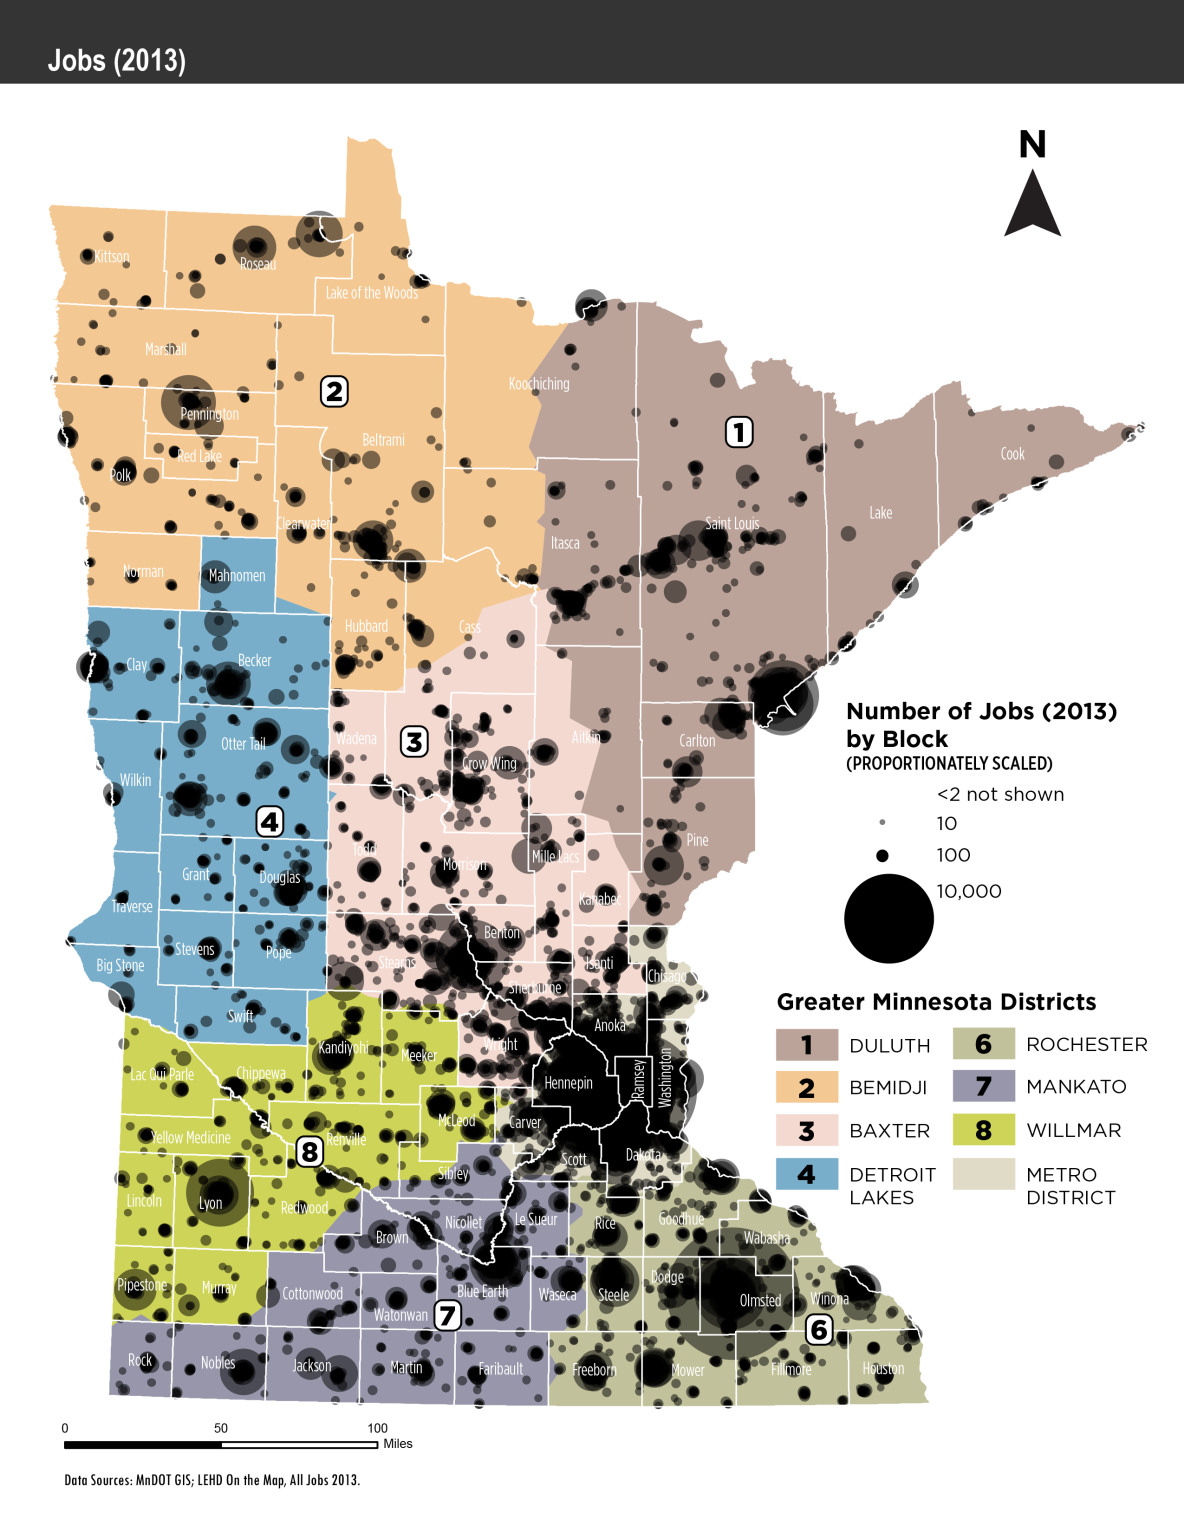
Figure 4-3 - Statewide Job Density by Census Tract
Vulnerable Populations
Transportation is often a primary barrier cited by individuals as to why they are unable to access employment, medical services and educational opportunities. For this reason, considering environmental justice is a vital component of a broader evaluation of statewide transportation policies and investment priorities. Presidential Executive Order 12898, issued in 1994, directed each federal agency to “make achieving environmental justice part of its mission by identifying and addressing, as appropriate, disproportionately high and adverse human health or environmental effects of its programs, policies and activities on minority and low-income populations”. The order builds on Title VI of the Civil Rights Act of 1964, which prohibits discrimination on the basis of race, color, or national origin.
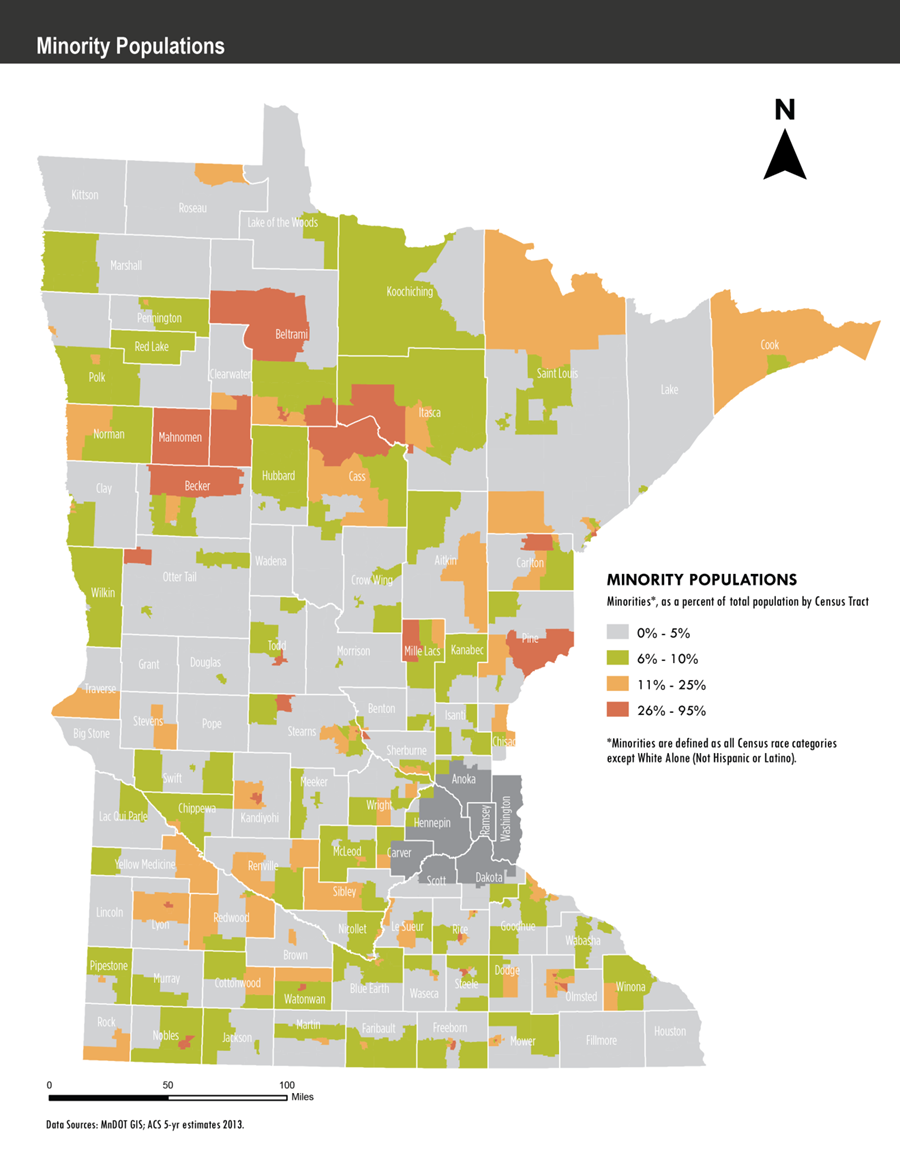
Distributions of minority populations have been included as part of this analysis to ensure minority populations are not disproportionately affected in an adverse manner. For this analysis minority populations are defined as all Census race categories except White Alone (Not Hispanic or Latino). Maps showing the distribution of minority populations in Greater Minnesota can be found in Technical Memo: Trends and Opportunities. In addition to identifying vulnerable populations, MnDOT took extensive measures to reach out to all sectors of the population during the development of this plan through surveys and meetings as explained in chapter 5. See the full report in Technical Memo: Environmental Justice and Appendix.
- Greater Minnesota has a higher percentage of White Alone than the state or the U.S. but a greater percentage of American Indians than state overall or the U.S.
- Minnesota has above national average rates of senior and youth populations. However, it ranks considerably below national averages for groups such as low-income, disabled and limited English proficiency.
- Greater Minnesota is similar to the state as a whole in terms of its share of environmental justice populations, with a slightly higher percentage of seniors, persons with disabilities, and low-income households. Greater Minnesota’s share of zero-vehicle households is slightly below that of the state, while the population with limited English proficiency is less than half the statewide average.
Figure 4-4 - Minority Populations
| Geography | Total Population | White Alone | Black Alone | Hispanic/ Latino | Asian Alone | American Indian /Alaska Native | Native Hawaiian/ Pacific Islander | Other Alone | Two or More |
| United States | 311,536,594 | 63.3% | 12.2% | 16.6% | 4.8% | 0.7% | 0.2% | 0.2% | 2.1% |
| Minnesota | 5,347,740 | 82.6% | 5.1% | 4.8% | 4.1% | 1% | 0% | 0.1% | 2.2% |
| Greater Minnesota | 2,458,193 | 90.6% | 1.5% | 3.5% | 1.3% | 1.5% | 0% | 0.1% | 1.5% |
Figure 4-5 - Greater Minnesota Vulnerable Populations
| Geography | Total Population | Senior Population (65+) | Youth (Under 18) | Low-Income Population [1] | Zero-Vehicle Households | Population with Disabilities [2] | Population with Limited English [3] |
| United States | 311,536,594 | 13.0% | 11.0% | 32.0% | 9.0% | 15.0% | 4.5% |
| Minnesota | 5,347,740 | 13.3% | 23.9% | 11.5% | 7.1% | 10.1% | 2.1% |
| Greater Minnesota | 2,458,193 | 15.7% | 23.5% | 12.0% | 6.1% | 11.4% | 1.0% |
[1] Low-income populations are defined by households making up to 150% of the poverty level. [2] Age 18 or older. [3] Age 5 or older who speak English “less than well”.
Source: ACS 5-YR Estimates 2013
Figure 4-6 - Minority Populations in Greater Minnesota
Transit Dependency Index
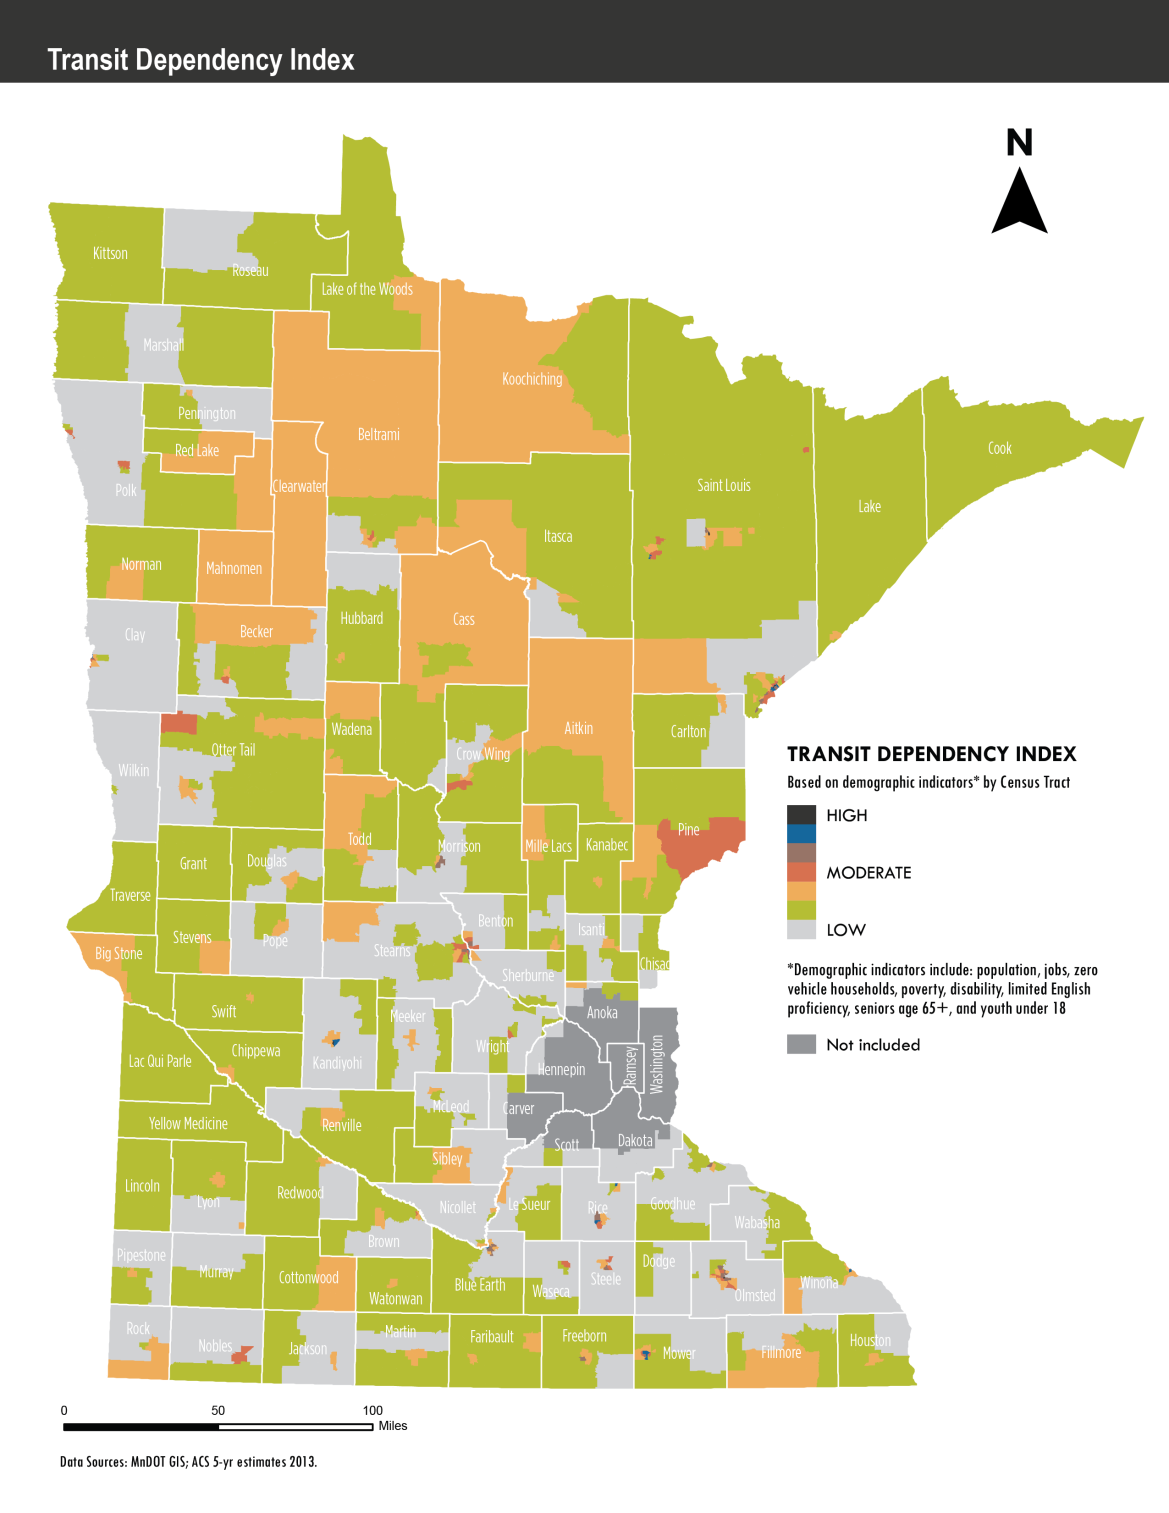
MnDOT developed a transit dependency index to highlight areas with concentrations of populations that may use transit. Factors considered in this analysis include densities of the following: population, employment, youth (under 18), older adults (age 65+), households without a vehicle, persons with a disability, limited English ability and low-income households. Further explanation of the methodology for this analysis is provided in Technical Memo: Trends and Opportunities.
- Population and Employment Density – Population and employment sites are key indicators of where transit may succeed.
- Youth Density – Youth, many of whom do not have a driver’s license or access to a vehicle, exhibit a higher overall need for transit than the general population. The percentage of the youth in Greater Minnesota is 23.5 percent, similar to the statewide average of 23.9 percent. Greater Minnesota counties with the highest shares of youth population include Mahnomen, Wright, Sherburne, and Dodge counties. In each of these counties, youth populations comprise more than 24 percent of the total population.
- Older Adult Density – Older adults typically use public transportation more frequently than the general population. Older adults often exhibit higher demand for transit as they become less capable or willing to drive themselves, or can no longer afford to own a car on a fixed income. Greater Minnesota counties with the highest shares of senior population include Aitkin, Traverse, Big Stone and Lincoln counties comprising more than 28 percent of the total population.
- Zero Vehicle households – One of the most influential indicators of transit need is whether a household has access to a car. This indicator may represent households without the economic means of owning a vehicle, households that choose not to own a car or individuals who are unable to drive, such as senior citizens and persons with disabilities. In Greater Minnesota, 6.1 percent of households do not have a vehicle available, slightly less than the statewide share of 7.1 percent. Greater Minnesota counties with the highest percentages of zero vehicle households include Mahnomen (10.7 percent), St. Louis (9.5 percent) and Koochiching (9 percent).
- Low-Income Populations – Low-income households earn up to 150 percent of the federal poverty threshold. In Greater Minnesota, 12 percent of households are classified as low-income, slightly above the statewide share of 11.5 percent. Greater Minnesota counties with the highest percentages of low-income households include Mahnomen (26.2 percent), Beltrami (21.9 percent) and Blue Earth (19.2 percent).
- Persons with Disabilities – Persons with disabilities are often heavily dependent on public transit service. Of residents over the age of 17 in Greater Minnesota, 11.4 percent have a disability, slightly higher than the statewide average of 10.1 percent. Greater Minnesota counties with the highest percentages of persons with disabilities include Aitkin (18.6 percent), Clearwater (17.1 percent) and Koochiching (17.1 percent).
- Persons with Limited English Proficiency – Limited English proficiency can be another indicator of a household’s relative dependency on transit. In Greater Minnesota, only 1 percent of residents speak English “less than well.” This is lower than the statewide average of 2.1 percent and the nationwide average of 4.5 percent.
Figure 4-7 shows the Statewide Transit Dependency Index across Greater Minnesota. Areas with the highest population density have the highest levels of transit dependency. In general, higher levels of transit dependency in rural areas are wider spread across the northern half of the state, with lower transit dependency radiating from the fringes of the Twin Cities Metropolitan Area.
Figure 4-7. Statewide Transit Dependency
Trends Affecting Transit in Greater Minnesota
Transit service must meet the times and places where people need to travel. Transit systems must evolve as demographics and lifestyles change. How people access information, the makeup of a typical household, shifting job markets, and the size of generational groups all affect the need for and design of public transportation.
Demorgraphic Trends
Demographics – the quantifiable characteristics of a population – by their very nature are constantly changing in society. Demographic trends affect the need for public services such as transit. By comparing rates of change in Greater Minnesota to the country overall, unique transportation needs begin to emerge.
Demographics
- People in Greatern Minnesota will remain spread out – Population is not set to increase greatly, meaning very rural areas will likely remain very rural.
- Urban area population is increasing – Population in urban areas keeps rising. Access to transit and vibrant walkable/bikeable neighborhoods in city centers may make urban living more attractive to millennials and older adults alike. With increased density in population, opportunity arises to enhance urban services, including transit.
- Increase in foreign population – Transit providers should provide bilingual information materials, so foreign born and non-English speaking populations have equitable access to transit services.
- New family definition – Smaller household size and more nonfamily households redefine how outreach is done. Combined with the increasing population, an increase in housing units has the potential to influence transit capacity and access needs. As the number of female heads of household increase, accommodating trip chaining to multiple destinations is needed to attract and retain riders.
- Large population of people with disabilities – Greater Minnesota has a high percentage of people with disabilities. These populations require accessible vehicles and meeting increasing demand over time must be achieved through partnerships with state human services agencies.
Economy
Many aspects of Greater Minnesota’s economy affect the need and demand for transit, such as income levels, employment sectors and changes in technology. An increase in poverty potentially increases the number of persons that have difficulty affording a personal vehicle and are in need of access to jobs and to other services. Rates of employment impact the number of frequent transit customers. Since most people travel to work five days per week, a transit system that meets employment needs can capture a high number of frequent riders. The sectors of employment matter in terms of when people need to travel. Second and third shifts, common to Minnesota’s manufacturing sectors, require late night and early morning travel.
- Fewer people in poverty than national average – Greater Minnesota’s percentage of population in poverty remains lower than the nation overall.
- The Greater Minnesota economy has fared well – Unemployment rates are lower than the national average.
- The new economy is shifting transit demands – New forms of technology have spurred a sharing economy that has encouraged the development of new forms of transit. Autonomous cars are likely to further affect this in the future.
- Some millennials and baby boomers are driving less and/or contributing to a decrease in driving – Both generations exhibit similar patterns of wanting to live in walkable communities and choosing to take transit, walk, or bicycle rather than drive.
Development
The development of a sharing economy that uses technology to organize trips and potentially even drive vehicles changes transportation behavior. The following summary statements highlight these trends.
- Suburban development pattern continues – While urban area population is growing, much of that population is occurring outside the traditional downtown core of Greater Minnesota’s urbanized areas. This is requiring transit agencies to expand service areas beyond city borders.
- Job diversification with varied shift times – In certain parts of the state, manufacturing jobs are declining while other regions are increasing. These jobs have various shift times including first, second, and third shifts that are challenging for transit agencies. Growth in health care and professional services could mean an increase in those commuting during typical 9-5 hours. Schedules for service sector jobs, particularly late evenings and weekends, can be challenging to coordinate with transit.
Public Policy
Public health should be considered for future transit investments. Given the trends in older adults, transportation investments in walking, bicycling, and transit infrastructure and programs can increase physical activity and support access to public transit. A proactive health approach can also reduce the chance of older adults becoming mobility limited. The link between transportation and public health has become prominent through a variety of factors such as:
- Pollution – The transportation sector is the second biggest source of greenhouse gas emissions, which can heighten the risk of asthma and other respiratory problems and also contributes to climate change.
- Access to health care – Reliable transportation means people can access medical services and receive preventive treatments that ward off chronic disease.
- Physical activity rates – Active forms of transportation can increase physical activity and reduce obesity and the risk of heart attack. This is particularly relevant for Minnesota where heart disease is the second most common cause of death. [26]
The markets and trends in Greater Minnesota described above help shape the transit investment strategies to provide services that address these trends and meet the needs of customers.
A full summary of factors contributing to changes in Greater Minnesota is available in Technical Memo: Trends and Opportunities
26. Minnesota Statewide Multimodal Transportation Plan: Trends Analysis Summary.