Chapter 3 – Transit in Greater Minnesota
- No related sections.
Greater Minnesota's Transit Systems
- No related sections.
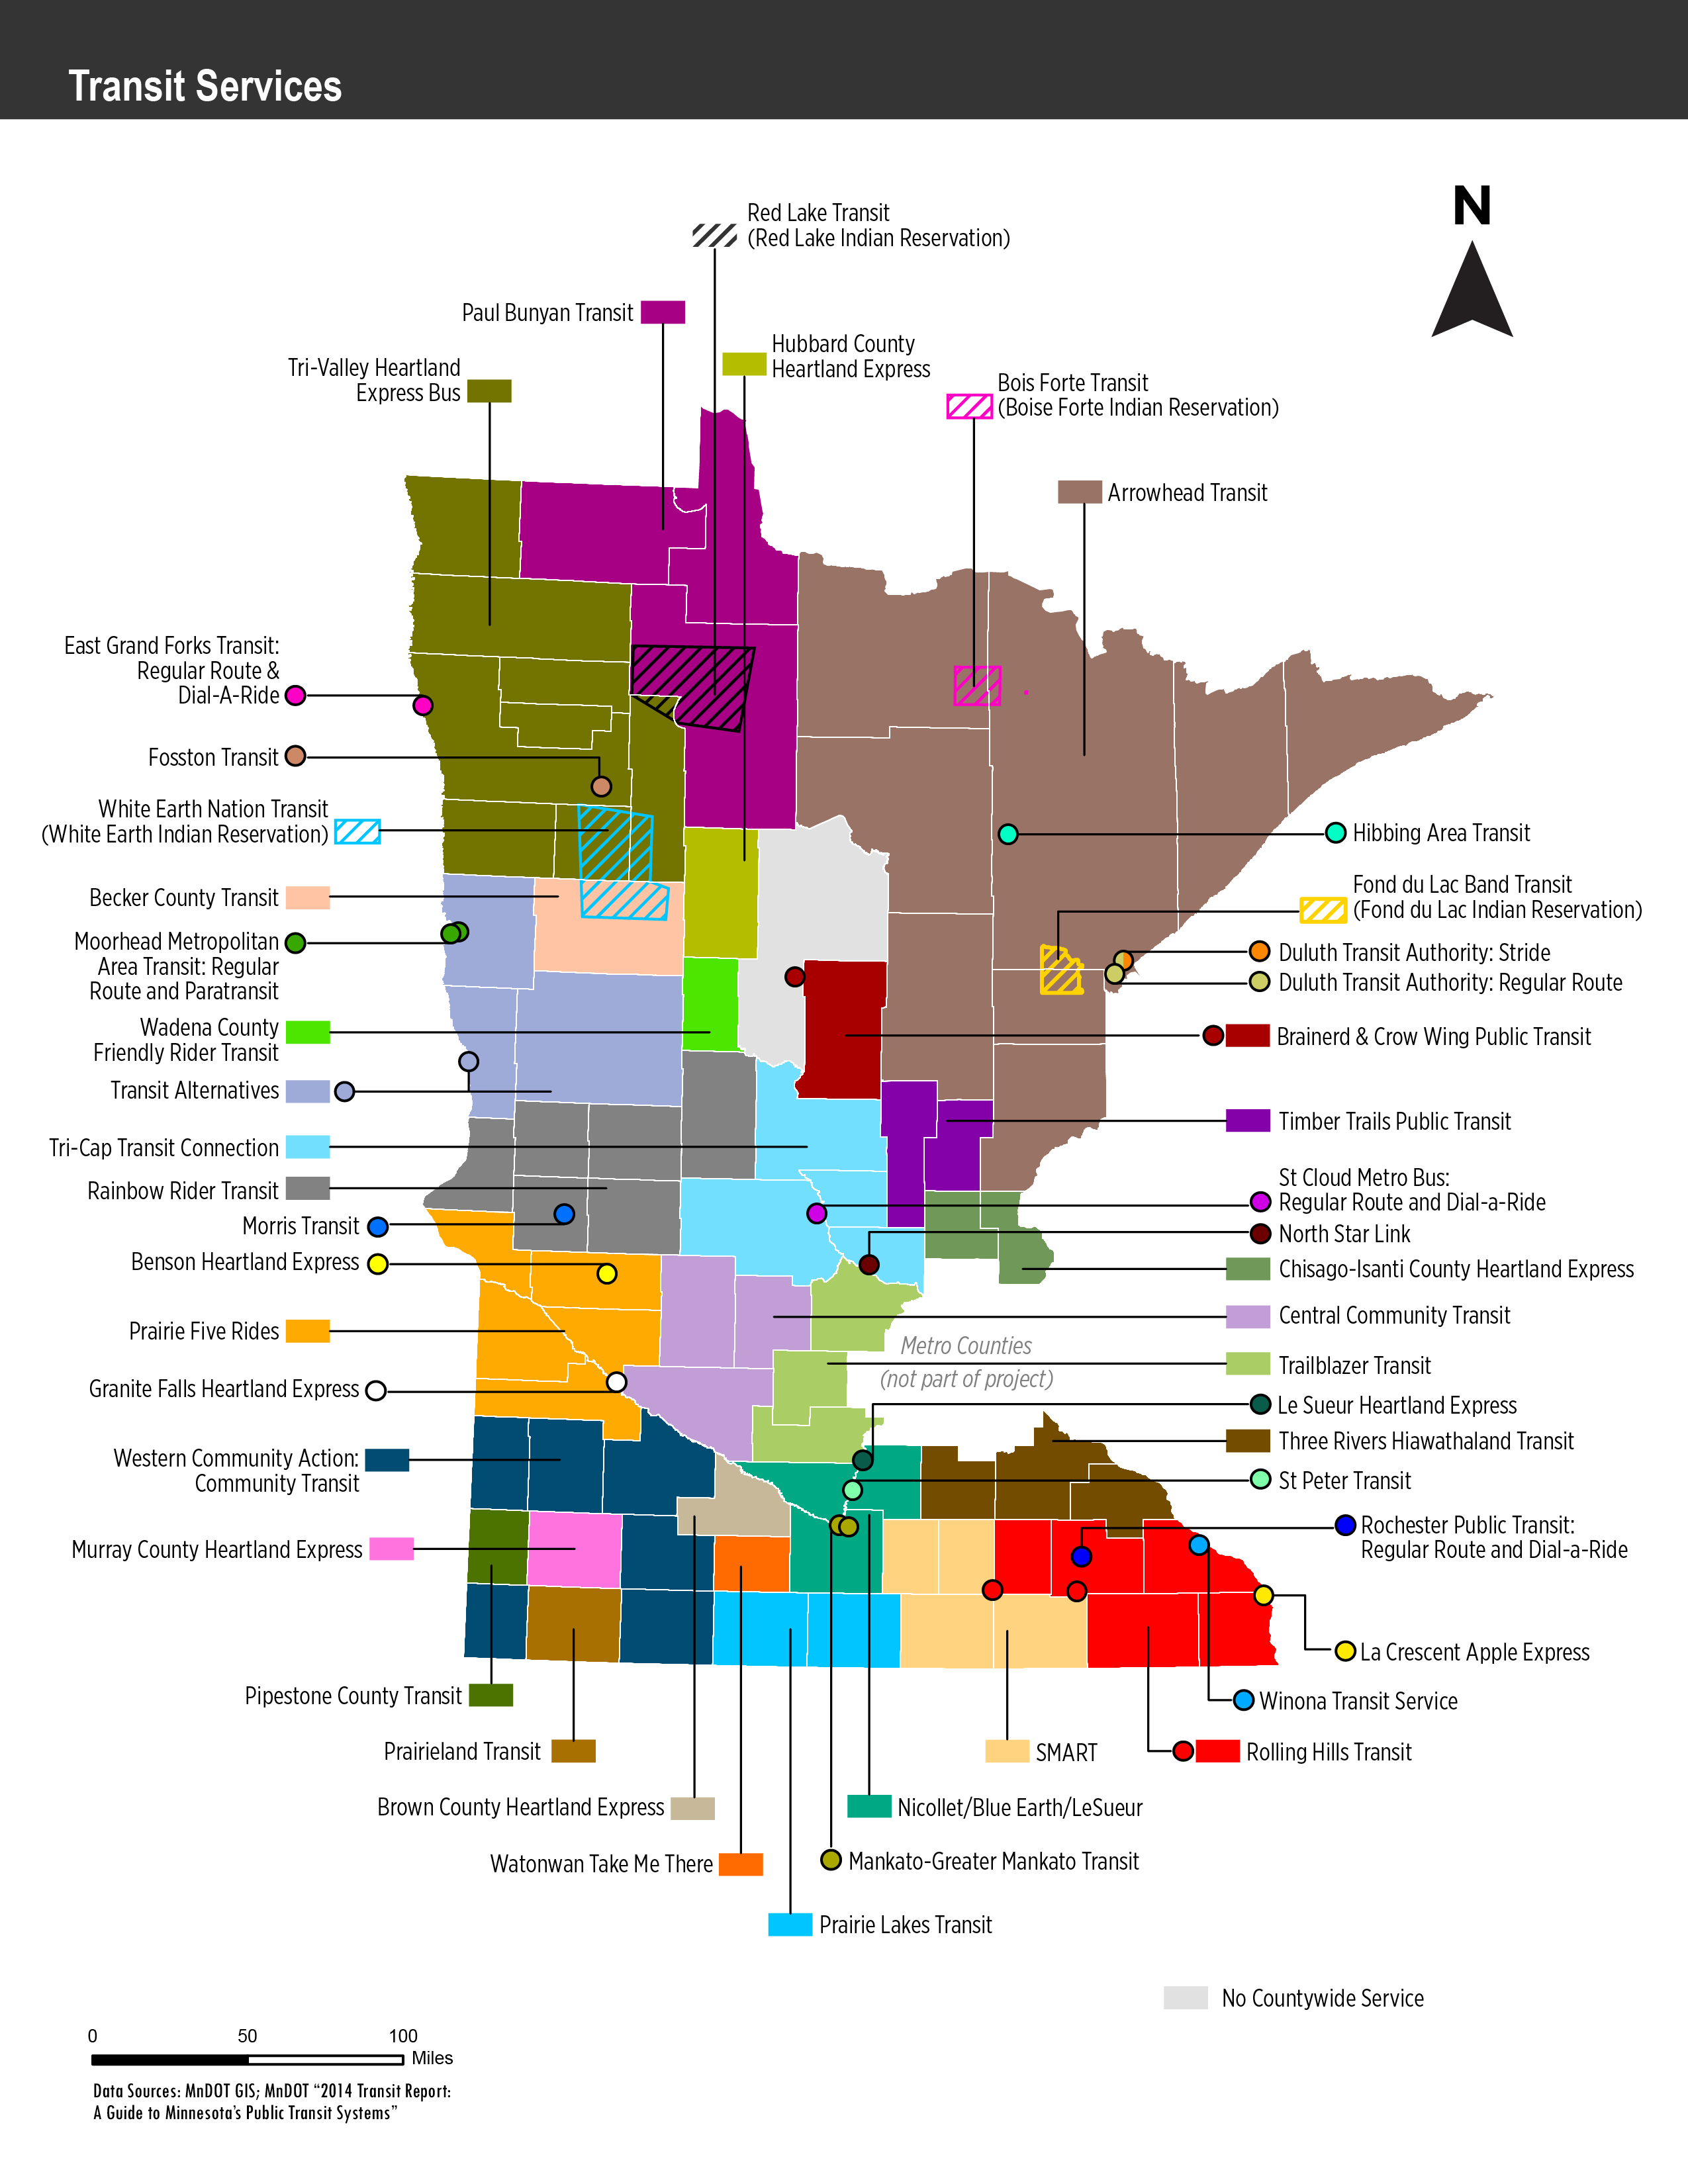
As of June 2016, Greater Minnesota had 44 public transit systems and two direct recipient tribes serving the 80 counties. They operate a variety of service formats based on the population, land use and the size of the service area
Rural Transit Service
MnDOT supports 30 county and multi-county systems in addition to two tribal systems. These systems provide service for much of Greater Minnesota and rural areas. These systems use primarily demand responsive service. Demand-response is defined as service to individuals that is activated based on passenger requests. Usually passengers call the scheduler or dispatcher and request rides for particular dates and times. Demand response usually involves curb-to-curb or door-to-door service. Trips may be scheduled on an advanced reservation basis (also known as “Dial-A-Ride”) or in “real-time.” Usually smaller vehicles are used to provide demand-response service. This type of service usually provides the highest level of service to the passenger but is the most expensive for the transit system to operate. In rural areas with relatively high populations of elderly persons and persons with disabilities, demand-response service is sometimes the most appropriate type of service.
Small Urban Transit Service
MnDOT supports seven small urban transit systems. These systems serve small cities from 2,500–49,999 in population, and primarily run route-deviation type service. With route-deviation service, transit buses travel along a predetermined alignment or path with scheduled time points at each terminal point and in some instances at key intermediate locations. Route deviation service is different from conventional fixed route bus service in that the vehicle may leave the route upon requests of passengers to be picked up or returned to destinations near the route. Following an off-route deviation, the vehicle typically returns to the point at which it left the route. Passengers may call in advance for route deviation or may access the system at predetermined route stops. The limited geographic area within which the vehicle may travel off the route is known as the route deviation corridor.
Urbanized or "Large Urban" Transit Service
MnDOT supports seven urbanized systems. These systems serve cities with a population between 50,000 and 200,000. Urbanized systems primarily run fixed-route service. Fixed route is service that is provided on a repetitive, fixed-schedule basis along a specific route, with vehicles stopping to pick up passengers at and deliver passengers to specific stops. Fixed route service carries a higher number of people because they serve large cities and generally have very good reliability and on-time performance because of the fixed schedule. The frequency, or time in between buses, can vary based on the route from 15 minutes to one hour. This makes service predictable and consistent.
In addition to fixed route service, all urbanized systems must provide ADA Complementary Para-transit Service for eligible individuals who are unable to use the fixed-route service. This is part of the Americans with Disabilities Act of 1990, the law passed by Congress, which makes it illegal to discriminate against people with disabilities in employment, services provided by state and local governments, public and private transportation, public accommodations and telecommunications.
Figure 3-1 - Transit Agencies in Greater Minnesota

As a whole, Greater Minnesota transit systems reached record highs for ridership and service hours in 2015, with 12.1 million boardings and 1.17 million hours of revenue service. To understand short-term performance trends among transit systems in Greater Minnesota, this analysis covers a five-year period for a variety of indicators. While some rural systems have consolidated in recent years, the most significant structural change to Greater Minnesota’s transit system classifications has been the shift of the Greater Mankato Transit System from a small urban to an urbanized system in 2013 when the population increased to more than 50,000. This reclassification resulted in modest increases in service levels, costs and ridership for urbanized systems. It resulted in a dramatic reduction in these measures among small urban systems.
Transit Ridership
- No related sections.
Overall transit ridership in Greater Minnesota grew more than 8 percent from 2010-2015. The largest gain (14.4 percent) occurred in urbanized systems. Ridership on rural systems increased 12.6 percent (see Figure 3-2). A significant portion of the increase in transit ridership for urbanized systems is due to the reclassification of the Greater Mankato Transit System in 2013, previously classified as small urban. Prior to 2013, the urbanized systems had an overall growth of nearly 7 percent.
Figure 3-2 - Greater Minnesota Public Transit Ridership - 2010 to 2015
| 2010 | 2011 | 2012 | 2013 | 2014 | 2015 | 5-Year Change | |
| Rural | 2,752,841 | 2,743,803 | 2,657,177 | 2,886,968 | 3,098,512 | 3,239,748 | 12.6 |
| Small Urban* | 997,611 | 1,026,128 | 1,080,202 | 601,447 | 535,794 | 522,067 | -46.3% |
| Urbanized* | 7,142,360 | 7,500,943 | 7,623,481 | 8,162,658 | 8,171,122 | 7,976,926 | 14.4% |
| ADA-Complementary Paratransit | 222,528 | 224,484 | 215,013 | 210,789 | 233,800 | 242,671 | 5.1% |
| Greater Minnesota | 11,115,340 | 11,495,358 | 11,575,873 | 11,861,862 | 12,039,228 | 11,981,412 | 9.2% |
*Greater Mankato Transit System was reclassified as an Urbanized System in 2013
Revenue Hours
- No related sections.
Transit revenue hours in Greater Minnesota grew by almost 9 percent during the five-year period. The largest gain (18 percent) occurred in the rural systems, as shown in Figure 3-3. The urbanized systems and ADA-complementary paratransit services grew by more than 7 percent.
Figure 3-3 - Greater Minnesota Public Transit Revenue Hours - 2010 to 2015
| Systems | 2010 | 2011 | 2012 | 2013 | 2014 | 2015 | 5-Year Change |
| Rural | 564,307 | 554,671 | 563,803 | 610,653 | 665,827 | 683,876 | 18.0% |
| Small Urban* | 95,879 | 96,776 | 90,534 | 64,308 | 56,527 | 56,565 | -41.0% |
| Urbanized* | 322,072 | 336,261 | 333,382 | 343,677 | 346,724 | 348,905 | 7.7% |
| ADA-Complementary Paratransit | 85,850 | 88,340 | 87,493 | 89,434 | 91,994 | 100,036 | 7.2% |
| Greater Minnesota | 1,068,108 | 1,076,048 | 1,075,212 | 1,108,072 | 1,161,072 | 1,189382 | 8.9% |
*Greater Mankato Transit System was reclassified as an Urbanized System in 2013
The increase in hours and increase in riders was nearly equal, showing that the productivity levels yielded from additional hours invested remained steady.
Annual Operating Costs
- No related sections.
Overall transit operating costs in Greater Minnesota increased by more than 25 percent ($15 million) during the five-year period, as shown in Figure 3-4. Urban systems experienced the most significant rise in operating costs (32 percent), with ADA services experiencing an additional increase of 18 percent. The decrease in small urban costs and increase in rural and urbanized systems is the result of the Mankato system being reclassified as an urban system in 2013 and some small urban systems merging with rural systems.
Figure 3-4 -Greater Minnesota Public Transit Annual Operating Costs - 2010 to 2015
| Systems | 2010 | 2011 | 2012 | 2013 | 2014 | 2015 | 5-Year Change |
| Rural | $26,831,360 | $28,207,803 | $28,596,297 | $31,233,351 | $35,747,852 | $37,927,260 | 33.2% |
| Small Urban* | $4,318,471 | $4,549,283 | 3,904,818 | $2,565,824 | $2,238,184 | $2,134,513 | -48.2% |
| Urbanized* | $22,899,589 | $24,923,373 | $26,830,385 | $28,737,075 | $30,219,815 | $30,689,094 | 31.9% |
| ADA-Complementary Paratransit | $4,475,655 | $4,739,045 | $4,702,382 | $4,730,007 | $5,281,240 | $6,098,096 | 17.9% |
| Greater Minnesota | $58,524,175 | $62,419,504 | $64,033,884 | $67,266,259 | $73,487,092 | $76,848,963 | 25.5% |
*Greater Mankato Transit System, previously a Small Urban System, was reclassified as an Urbanized System in 2013.
Note that operating costs are covered by a mix of state and federal funds, fares, contracted services and local contributions. The local share, and where it originates, varies from system to system. In some parts of Greater Minnesota, cities contribute to transit costs. In other areas, counties provide the local match. In other cases, agencies rely on revenues from contracts with human services providers. Finding additional local resources to match federal and state dollars is a challenge of expanding systems.
Service Span
- No related sections.
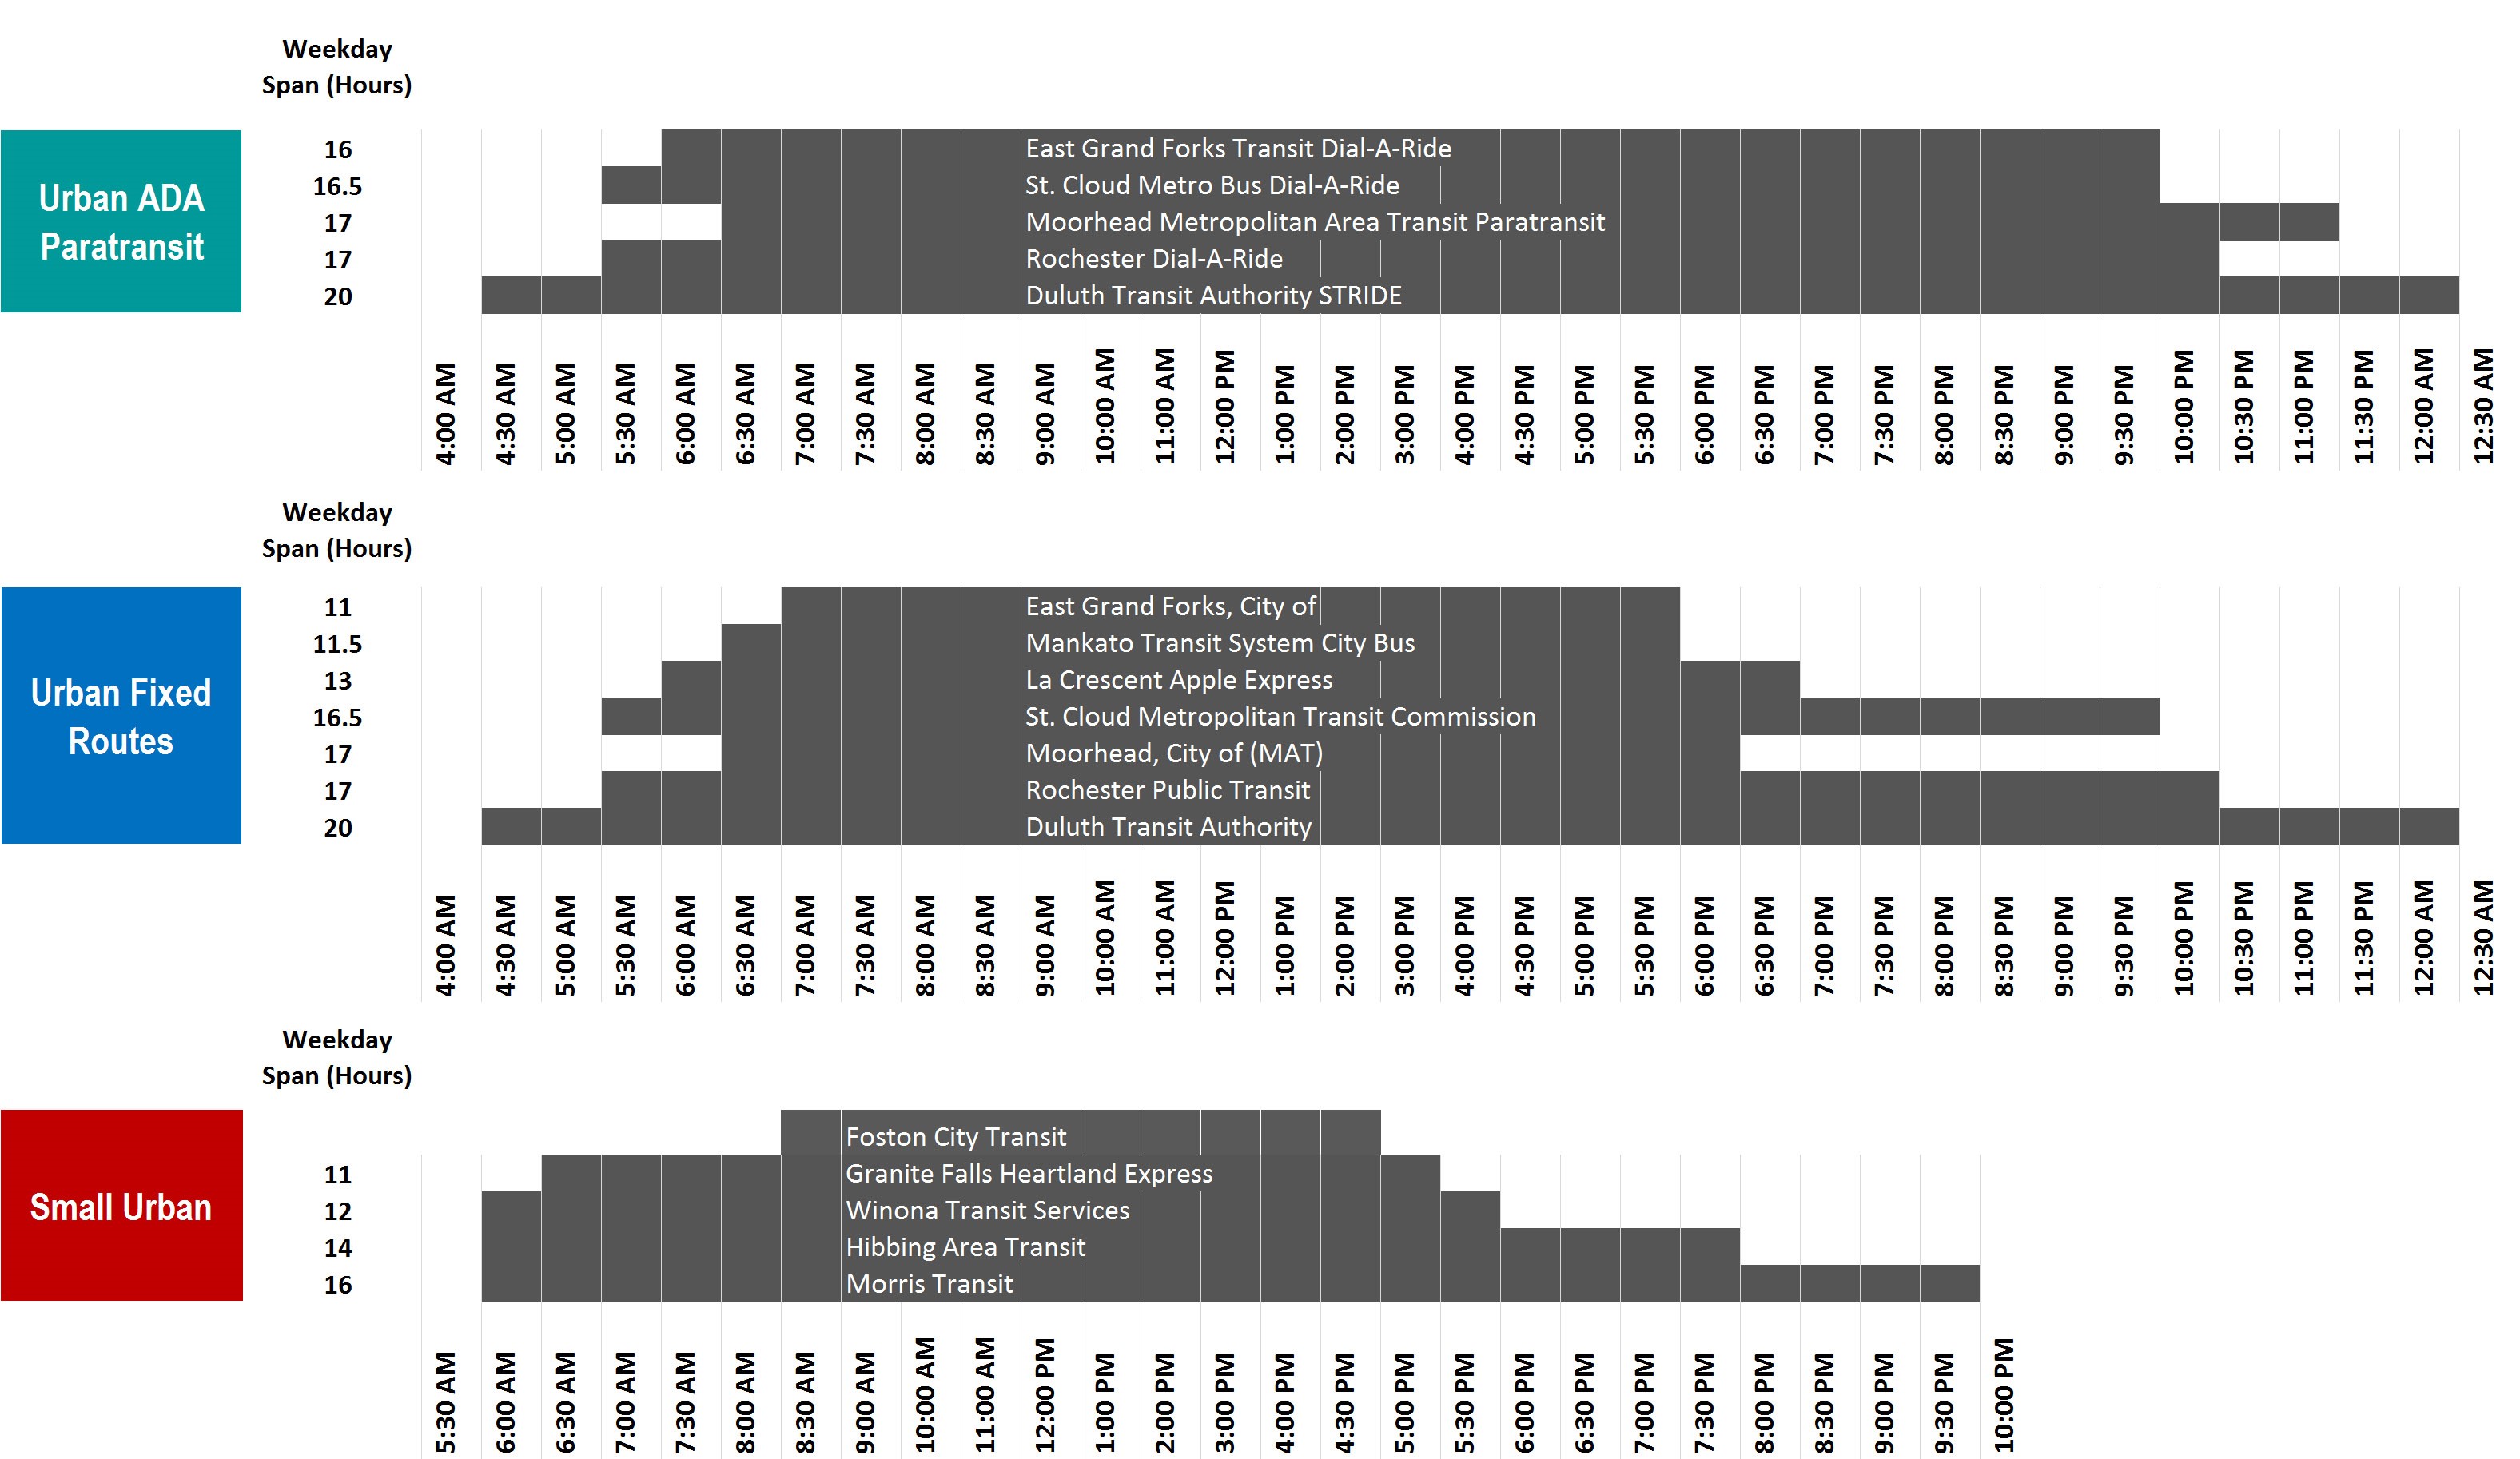
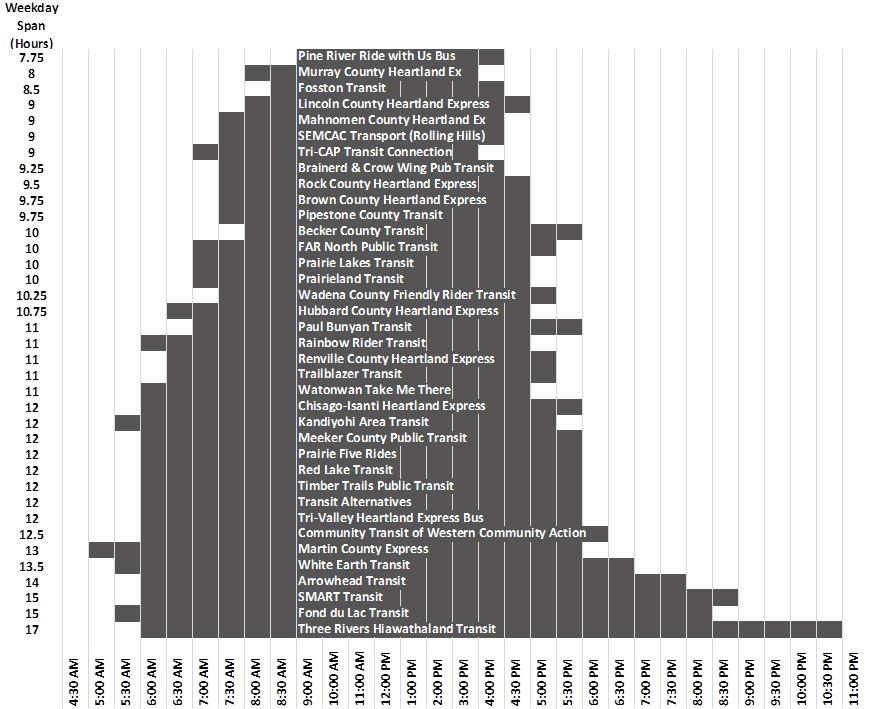
To understand how and where additional service hours can be added, it is necessary to evaluate the current level of transit service. Existing spans of service across Greater Minnesota vary greatly by system and size of communities served. Figure 3-5 and Figure 3-6 show existing Greater Minnesota service spans. Each row represents weekday hours of operation for a specific system. Urbanized services begin operations as early as 4:30 a.m. and end as late as 12:30 a.m. (Duluth Transit Authority). All systems are in operation between the hours of 7 a.m. and 6 p.m. on weekdays. Small urban services begin operations as early as 6 a.m. and end as late as 10 p.m. All small urban systems are operational on weekdays between the hours of 7 a.m. and 4:30 p.m. rural services begin operations as early as 5 a.m. and end as late as 11 p.m. All rural systems are operational on weekdays between the hours of 9 a.m. and 4 p.m.
Note, a full and detailed analysis of financial and operating statistics for MnDOT transit systems and peer state systems is available in: Technical Memo: Peer Review.
Figure 3-5 - Existing Service Spans - Urban and Small Urban

Figure 3-6 - Existing Service Spans - Rural

Sections in Chapter
